Ethiopian vs German Single Mother Poverty
COMPARE
Ethiopian
German
Single Mother Poverty
Single Mother Poverty Comparison
Ethiopians
Germans
27.7%
SINGLE MOTHER POVERTY
98.4/ 100
METRIC RATING
88th/ 347
METRIC RANK
30.0%
SINGLE MOTHER POVERTY
8.8/ 100
METRIC RATING
220th/ 347
METRIC RANK
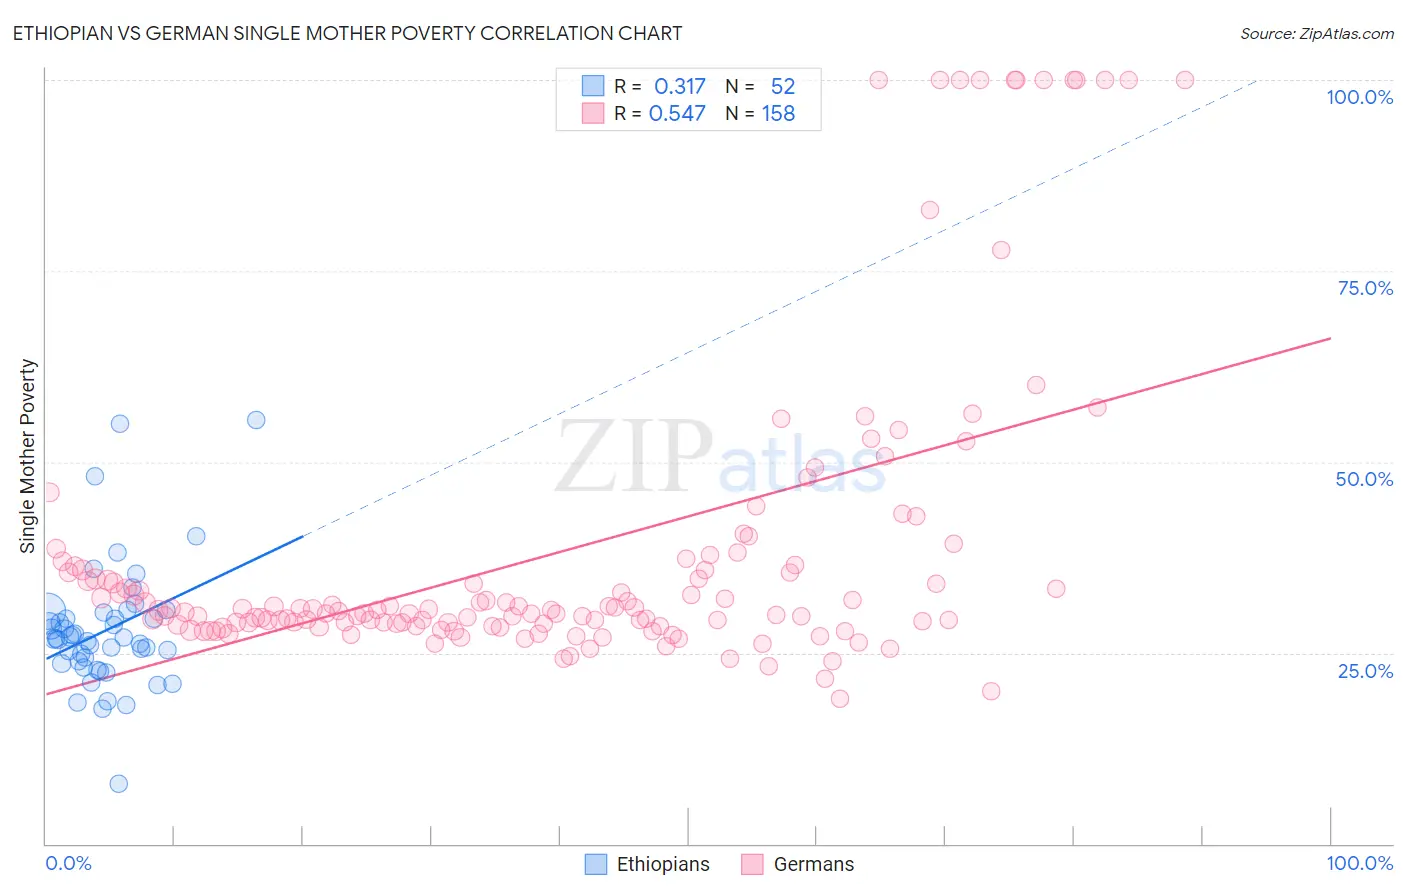
Ethiopian vs German Single Mother Poverty Correlation Chart
The statistical analysis conducted on geographies consisting of 220,975,245 people shows a mild positive correlation between the proportion of Ethiopians and poverty level among single mothers in the United States with a correlation coefficient (R) of 0.317 and weighted average of 27.7%. Similarly, the statistical analysis conducted on geographies consisting of 549,975,731 people shows a substantial positive correlation between the proportion of Germans and poverty level among single mothers in the United States with a correlation coefficient (R) of 0.547 and weighted average of 30.0%, a difference of 8.2%.
Single Mother Poverty Correlation Summary
| Measurement | Ethiopian | German |
| Minimum | 7.9% | 18.9% |
| Maximum | 55.4% | 100.0% |
| Range | 47.5% | 81.1% |
| Mean | 27.9% | 38.1% |
| Median | 26.9% | 30.6% |
| Interquartile 25% (IQ1) | 23.7% | 28.8% |
| Interquartile 75% (IQ3) | 29.9% | 35.8% |
| Interquartile Range (IQR) | 6.1% | 7.1% |
| Standard Deviation (Sample) | 8.3% | 19.9% |
| Standard Deviation (Population) | 8.2% | 19.9% |
Similar Demographics by Single Mother Poverty
Demographics Similar to Ethiopians by Single Mother Poverty
In terms of single mother poverty, the demographic groups most similar to Ethiopians are Afghan (27.7%, a difference of 0.020%), Immigrants from Ethiopia (27.7%, a difference of 0.020%), Immigrants from Ukraine (27.7%, a difference of 0.12%), Immigrants from France (27.8%, a difference of 0.19%), and Mongolian (27.7%, a difference of 0.21%).
| Demographics | Rating | Rank | Single Mother Poverty |
| Immigrants | Scotland | 98.9 /100 | #81 | Exceptional 27.6% |
| Immigrants | Cameroon | 98.8 /100 | #82 | Exceptional 27.6% |
| Greeks | 98.7 /100 | #83 | Exceptional 27.7% |
| Immigrants | Latvia | 98.7 /100 | #84 | Exceptional 27.7% |
| Mongolians | 98.7 /100 | #85 | Exceptional 27.7% |
| Immigrants | Ukraine | 98.6 /100 | #86 | Exceptional 27.7% |
| Afghans | 98.5 /100 | #87 | Exceptional 27.7% |
| Ethiopians | 98.4 /100 | #88 | Exceptional 27.7% |
| Immigrants | Ethiopia | 98.4 /100 | #89 | Exceptional 27.7% |
| Immigrants | France | 98.2 /100 | #90 | Exceptional 27.8% |
| Immigrants | Albania | 98.0 /100 | #91 | Exceptional 27.8% |
| Estonians | 97.9 /100 | #92 | Exceptional 27.8% |
| Romanians | 97.8 /100 | #93 | Exceptional 27.8% |
| Albanians | 97.6 /100 | #94 | Exceptional 27.9% |
| Chileans | 97.5 /100 | #95 | Exceptional 27.9% |
Demographics Similar to Germans by Single Mother Poverty
In terms of single mother poverty, the demographic groups most similar to Germans are Finnish (30.0%, a difference of 0.070%), Immigrants from Eritrea (30.0%, a difference of 0.17%), Sudanese (30.0%, a difference of 0.18%), Hungarian (29.9%, a difference of 0.21%), and Immigrants from Cuba (30.1%, a difference of 0.31%).
| Demographics | Rating | Rank | Single Mother Poverty |
| Immigrants | Thailand | 12.0 /100 | #213 | Poor 29.9% |
| Liberians | 11.7 /100 | #214 | Poor 29.9% |
| Jamaicans | 11.7 /100 | #215 | Poor 29.9% |
| Immigrants | Western Africa | 11.5 /100 | #216 | Poor 29.9% |
| Immigrants | Ghana | 11.3 /100 | #217 | Poor 29.9% |
| Hungarians | 10.3 /100 | #218 | Poor 29.9% |
| Finns | 9.3 /100 | #219 | Tragic 30.0% |
| Germans | 8.8 /100 | #220 | Tragic 30.0% |
| Immigrants | Eritrea | 7.7 /100 | #221 | Tragic 30.0% |
| Sudanese | 7.6 /100 | #222 | Tragic 30.0% |
| Immigrants | Cuba | 6.9 /100 | #223 | Tragic 30.1% |
| Immigrants | Sudan | 6.5 /100 | #224 | Tragic 30.1% |
| Spanish | 6.3 /100 | #225 | Tragic 30.1% |
| Scottish | 6.0 /100 | #226 | Tragic 30.1% |
| Immigrants | Liberia | 5.9 /100 | #227 | Tragic 30.1% |