Zip Codes with the Highest Percentage of Population Employed in Sales & Related in Lawrence, KS
RELATED REPORTS & OPTIONS
Sales & Related
Lawrence
Compare Zip Codes
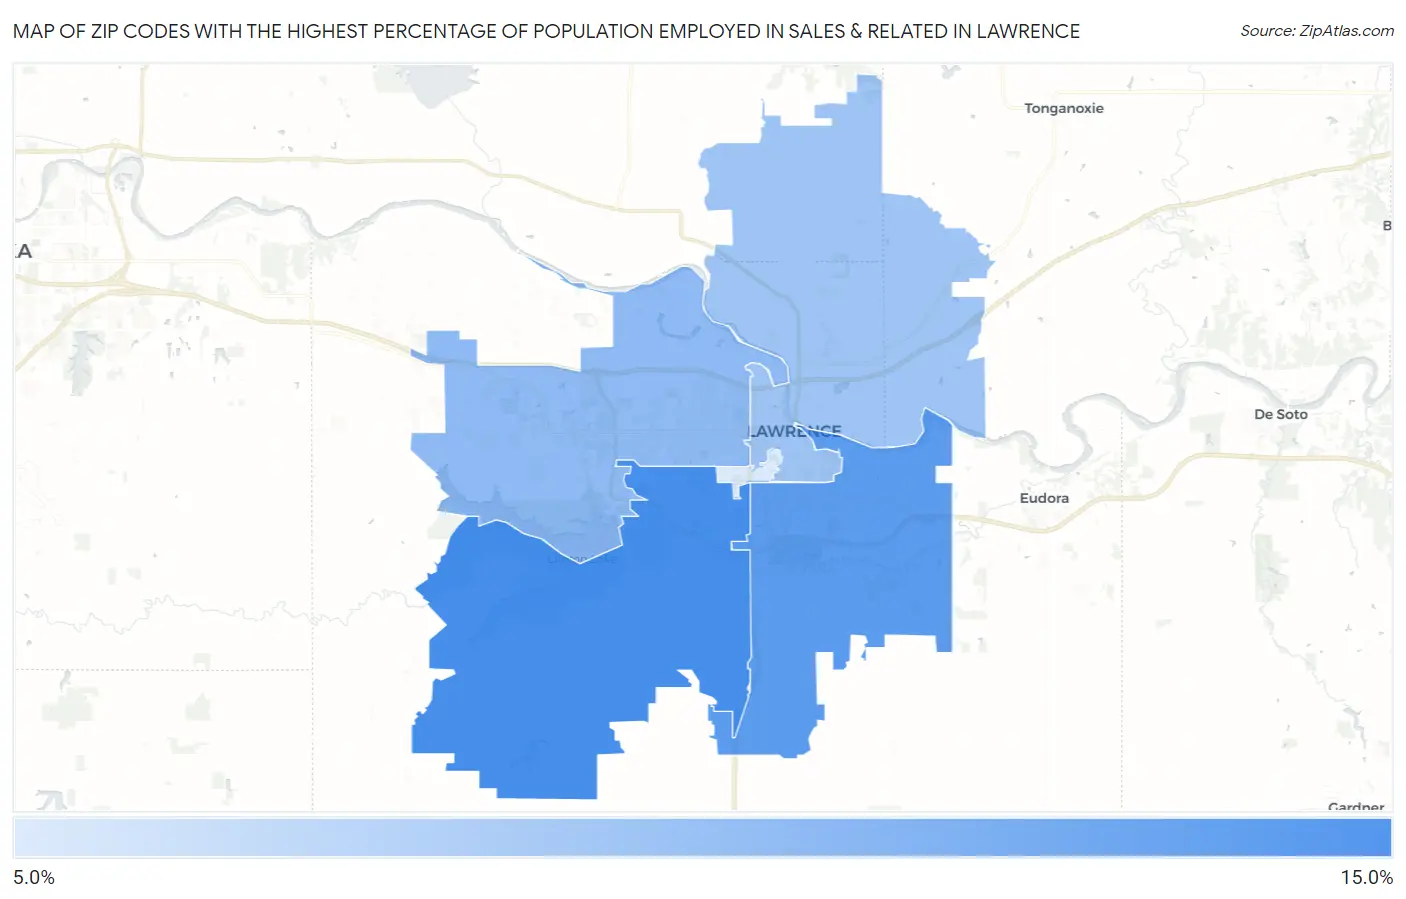
Map of Zip Codes with the Highest Percentage of Population Employed in Sales & Related in Lawrence
5.0%
10.8%
Zip Codes with the Highest Percentage of Population Employed in Sales & Related in Lawrence, KS
| Zip Code | % Employed | vs State | vs National | |
| 1. | 66047 | 10.8% | 9.3%(+1.54)#134 | 9.6%(+1.22)#8,672 |
| 2. | 66046 | 10.1% | 9.3%(+0.851)#160 | 9.6%(+0.531)#10,640 |
| 3. | 66049 | 8.1% | 9.3%(-1.22)#274 | 9.6%(-1.54)#17,868 |
| 4. | 66044 | 7.4% | 9.3%(-1.87)#321 | 9.6%(-2.19)#19,954 |
| 5. | 66045 | 5.0% | 9.3%(-4.25)#469 | 9.6%(-4.57)#25,522 |
1
Common Questions
What are the Top 3 Zip Codes with the Highest Percentage of Population Employed in Sales & Related in Lawrence, KS?
Top 3 Zip Codes with the Highest Percentage of Population Employed in Sales & Related in Lawrence, KS are:
What zip code has the Highest Percentage of Population Employed in Sales & Related in Lawrence, KS?
66047 has the Highest Percentage of Population Employed in Sales & Related in Lawrence, KS with 10.8%.
What is the Percentage of Population Employed in Sales & Related in Lawrence, KS?
Percentage of Population Employed in Sales & Related in Lawrence is 8.7%.
What is the Percentage of Population Employed in Sales & Related in Kansas?
Percentage of Population Employed in Sales & Related in Kansas is 9.3%.
What is the Percentage of Population Employed in Sales & Related in the United States?
Percentage of Population Employed in Sales & Related in the United States is 9.6%.