Zip Codes with the Highest Percentage of Population Employed in Farming, Fishing & Forestry in Lawrence, KS
RELATED REPORTS & OPTIONS
Farming, Fishing & Forestry
Lawrence
Compare Zip Codes
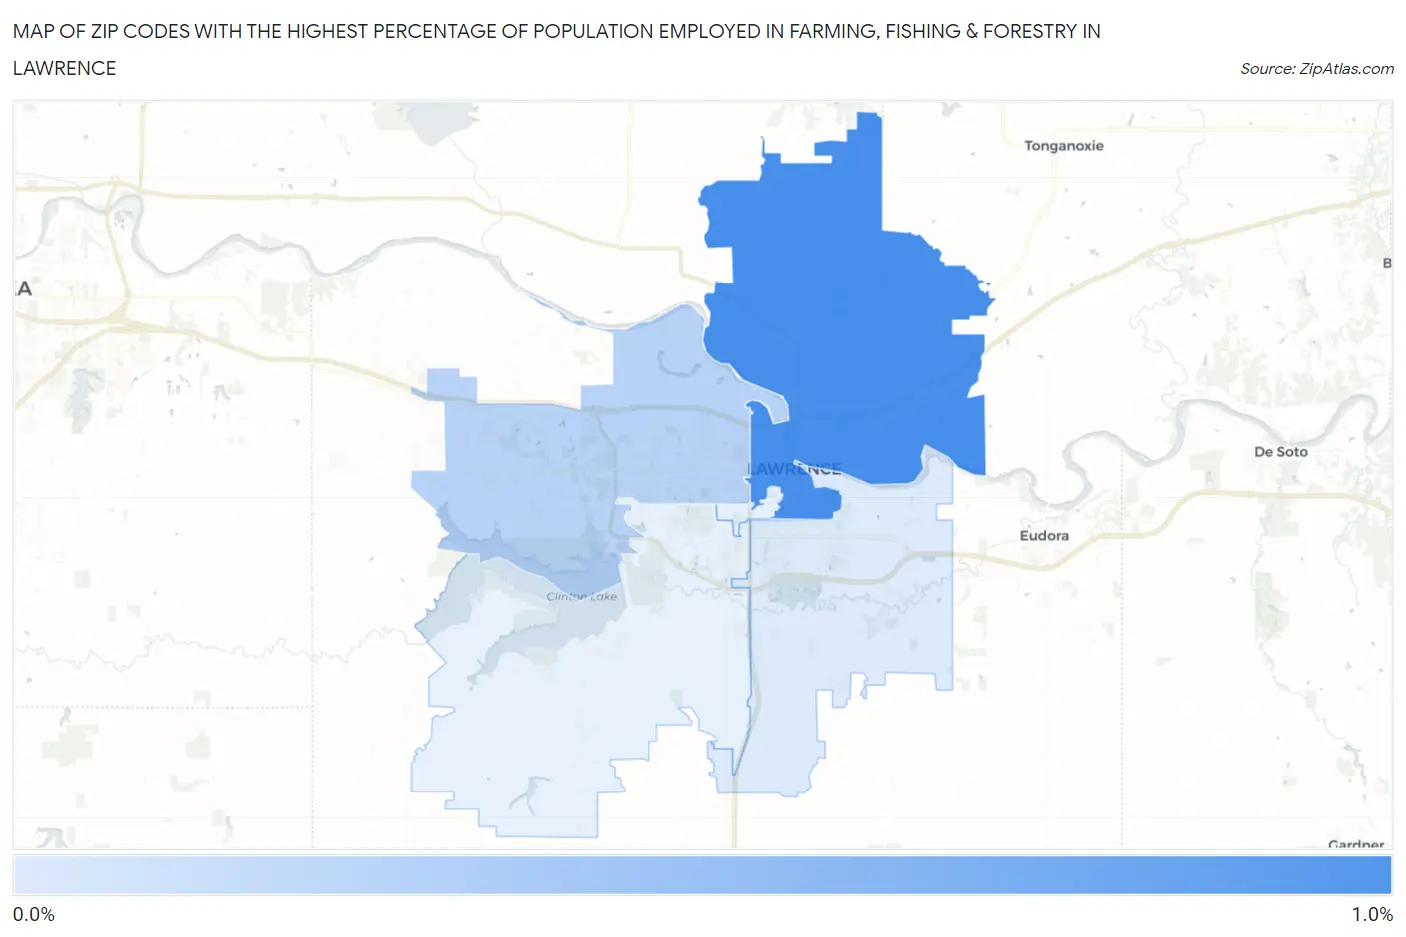
Map of Zip Codes with the Highest Percentage of Population Employed in Farming, Fishing & Forestry in Lawrence
0.0%
1.0%
Zip Codes with the Highest Percentage of Population Employed in Farming, Fishing & Forestry in Lawrence, KS
| Zip Code | % Employed | vs State | vs National | |
| 1. | 66044 | 0.89% | 0.91%(-0.021)#336 | 0.61%(+0.284)#10,286 |
| 2. | 66049 | 0.29% | 0.91%(-0.620)#414 | 0.61%(-0.315)#14,947 |
| 3. | 66046 | 0.095% | 0.91%(-0.815)#444 | 0.61%(-0.510)#17,843 |
1
Common Questions
What are the Top 3 Zip Codes with the Highest Percentage of Population Employed in Farming, Fishing & Forestry in Lawrence, KS?
Top 3 Zip Codes with the Highest Percentage of Population Employed in Farming, Fishing & Forestry in Lawrence, KS are:
What zip code has the Highest Percentage of Population Employed in Farming, Fishing & Forestry in Lawrence, KS?
66044 has the Highest Percentage of Population Employed in Farming, Fishing & Forestry in Lawrence, KS with 0.89%.
What is the Percentage of Population Employed in Farming, Fishing & Forestry in Lawrence, KS?
Percentage of Population Employed in Farming, Fishing & Forestry in Lawrence is 0.39%.
What is the Percentage of Population Employed in Farming, Fishing & Forestry in Kansas?
Percentage of Population Employed in Farming, Fishing & Forestry in Kansas is 0.91%.
What is the Percentage of Population Employed in Farming, Fishing & Forestry in the United States?
Percentage of Population Employed in Farming, Fishing & Forestry in the United States is 0.61%.