Yaqui vs Bermudan Per Capita Income
COMPARE
Yaqui
Bermudan
Per Capita Income
Per Capita Income Comparison
Yaqui
Bermudans
$36,112
PER CAPITA INCOME
0.0/ 100
METRIC RATING
315th/ 347
METRIC RANK
$42,911
PER CAPITA INCOME
30.1/ 100
METRIC RATING
189th/ 347
METRIC RANK
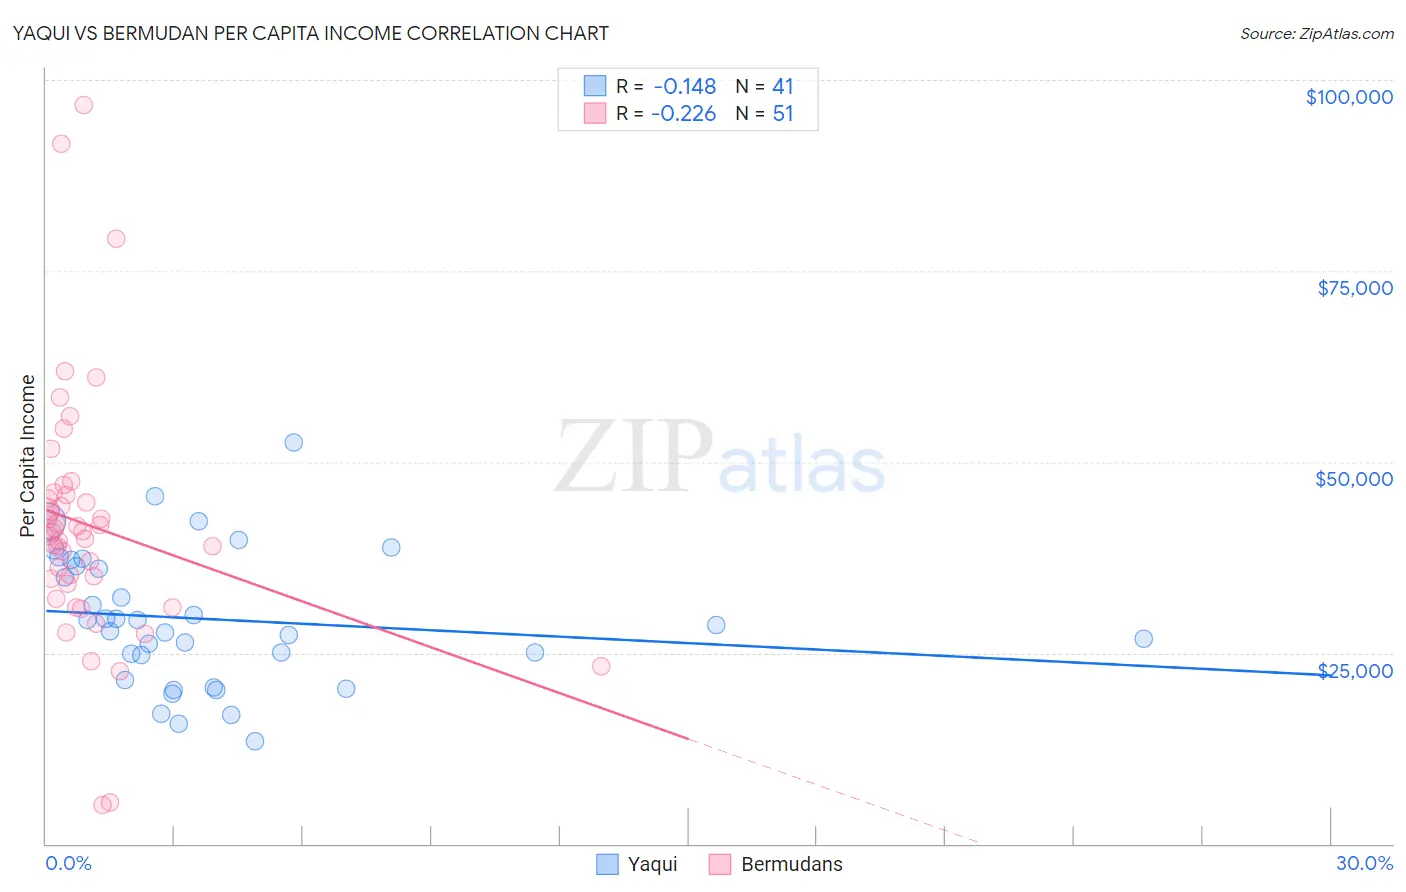
Yaqui vs Bermudan Per Capita Income Correlation Chart
The statistical analysis conducted on geographies consisting of 107,738,640 people shows a poor negative correlation between the proportion of Yaqui and per capita income in the United States with a correlation coefficient (R) of -0.148 and weighted average of $36,112. Similarly, the statistical analysis conducted on geographies consisting of 55,728,704 people shows a weak negative correlation between the proportion of Bermudans and per capita income in the United States with a correlation coefficient (R) of -0.226 and weighted average of $42,911, a difference of 18.8%.
Per Capita Income Correlation Summary
| Measurement | Yaqui | Bermudan |
| Minimum | $13,349 | $4,995 |
| Maximum | $52,546 | $96,710 |
| Range | $39,197 | $91,715 |
| Mean | $29,404 | $41,714 |
| Median | $28,671 | $40,756 |
| Interquartile 25% (IQ1) | $23,138 | $33,973 |
| Interquartile 75% (IQ3) | $36,720 | $45,741 |
| Interquartile Range (IQR) | $13,582 | $11,767 |
| Standard Deviation (Sample) | $8,788 | $16,477 |
| Standard Deviation (Population) | $8,680 | $16,314 |
Similar Demographics by Per Capita Income
Demographics Similar to Yaqui by Per Capita Income
In terms of per capita income, the demographic groups most similar to Yaqui are Seminole ($36,180, a difference of 0.19%), Choctaw ($35,999, a difference of 0.31%), Dutch West Indian ($35,922, a difference of 0.53%), Bangladeshi ($35,897, a difference of 0.60%), and Bahamian ($36,427, a difference of 0.87%).
| Demographics | Rating | Rank | Per Capita Income |
| Fijians | 0.0 /100 | #308 | Tragic $36,690 |
| Immigrants | Honduras | 0.0 /100 | #309 | Tragic $36,665 |
| Ute | 0.0 /100 | #310 | Tragic $36,651 |
| Chippewa | 0.0 /100 | #311 | Tragic $36,631 |
| Chickasaw | 0.0 /100 | #312 | Tragic $36,475 |
| Bahamians | 0.0 /100 | #313 | Tragic $36,427 |
| Seminole | 0.0 /100 | #314 | Tragic $36,180 |
| Yaqui | 0.0 /100 | #315 | Tragic $36,112 |
| Choctaw | 0.0 /100 | #316 | Tragic $35,999 |
| Dutch West Indians | 0.0 /100 | #317 | Tragic $35,922 |
| Bangladeshis | 0.0 /100 | #318 | Tragic $35,897 |
| Immigrants | Congo | 0.0 /100 | #319 | Tragic $35,720 |
| Hispanics or Latinos | 0.0 /100 | #320 | Tragic $35,688 |
| Blacks/African Americans | 0.0 /100 | #321 | Tragic $35,564 |
| Creek | 0.0 /100 | #322 | Tragic $35,546 |
Demographics Similar to Bermudans by Per Capita Income
In terms of per capita income, the demographic groups most similar to Bermudans are Immigrants from Africa ($42,950, a difference of 0.090%), Immigrants from Colombia ($42,971, a difference of 0.14%), French Canadian ($43,003, a difference of 0.21%), Immigrants ($43,010, a difference of 0.23%), and Kenyan ($42,808, a difference of 0.24%).
| Demographics | Rating | Rank | Per Capita Income |
| Immigrants | Vietnam | 38.1 /100 | #182 | Fair $43,229 |
| Germans | 33.9 /100 | #183 | Fair $43,067 |
| Spaniards | 32.9 /100 | #184 | Fair $43,028 |
| Immigrants | Immigrants | 32.5 /100 | #185 | Fair $43,010 |
| French Canadians | 32.3 /100 | #186 | Fair $43,003 |
| Immigrants | Colombia | 31.5 /100 | #187 | Fair $42,971 |
| Immigrants | Africa | 31.0 /100 | #188 | Fair $42,950 |
| Bermudans | 30.1 /100 | #189 | Fair $42,911 |
| Kenyans | 27.7 /100 | #190 | Fair $42,808 |
| Yugoslavians | 27.4 /100 | #191 | Fair $42,792 |
| Iraqis | 26.7 /100 | #192 | Fair $42,760 |
| Immigrants | Sierra Leone | 26.5 /100 | #193 | Fair $42,752 |
| Immigrants | Fiji | 25.2 /100 | #194 | Fair $42,694 |
| Immigrants | Kenya | 24.5 /100 | #195 | Fair $42,661 |
| Dutch | 23.4 /100 | #196 | Fair $42,605 |