Yaqui vs Immigrants from Eastern Europe Per Capita Income

COMPARE

Yaqui
Race
Ancestry
AfghanAfricanAlaska NativeAlaskan AthabascanAlbanianAleutAlsatianAmericanApacheArabArapahoArgentineanArmenianAssyrian/Chaldean/SyriacAustralianAustrianBahamianBangladeshiBarbadianBasqueBelgianBelizeanBermudanBhutaneseBlackfeetBolivianBrazilianBritishBritish West IndianBulgarianBurmeseCajunCambodianCanadianCape VerdeanCarpatho RusynCelticCentral AmericanCentral American IndianCherokeeCheyenneChickasawChileanChineseChippewaChoctawColombianColvilleComancheCosta RicanCreeCreekCroatianCrowCubanCypriotCzechCzechoslovakianDanishDelawareDominicanDutchDutch West IndianEastern EuropeanEcuadorianEgyptianEnglishEstonianEthiopianEuropeanFijianFilipinoFinnishFrenchFrench American IndianFrench CanadianGermanGerman RussianGhanaianGreekGuamanian/ChamorroGuatemalanGuyaneseHaitianHmongHonduranHopiHoumaHungarianIcelanderIndian (Asian)IndonesianInupiatIranianIraqiIrishIroquoisIsraeliItalianJamaicanJapaneseJordanianKenyanKiowaKoreanLaotianLatvianLebaneseLiberianLithuanianLumbeeLuxembourgerMacedonianMalaysianMalteseMarshalleseMenomineeMexicanMexican American IndianMongolianMoroccanNative HawaiianNavajoNepaleseNew ZealanderNicaraguanNigerianNorthern EuropeanNorwegianOkinawanOsageOttawaPaiutePakistaniPalestinianPanamanianParaguayanPennsylvania GermanPeruvianPimaPolishPortuguesePotawatomiPuebloPuerto RicanPuget Sound SalishRomanianRussianSalvadoranSamoanScandinavianScotch-IrishScottishSeminoleSenegaleseSerbianShoshoneSierra LeoneanSiouxSlavicSlovakSloveneSomaliSouth AfricanSouth AmericanSouth American IndianSoviet UnionSpaniardSpanishSpanish AmericanSpanish American IndianSri LankanSubsaharan AfricanSudaneseSwedishSwissSyrianTaiwaneseThaiTlingit-HaidaTohono O'OdhamTonganTrinidadian and TobagonianTsimshianTurkishU.S. Virgin IslanderUgandanUkrainianUruguayanUteVenezuelanVietnameseWelshWest IndianYakamaYaquiYugoslavianYumanYup'ikZimbabwean
Immigration
NonimmigrantsImmigrantsAfghanistanAfricaAlbaniaArgentinaArmeniaAsiaAustraliaAustriaBahamasBangladeshBarbadosBelarusBelgiumBelizeBoliviaBosnia and HerzegovinaBrazilBulgariaBurma/MyanmarCabo VerdeCambodiaCameroonCanadaCaribbeanCentral AmericaChileChinaColombiaCongoCosta RicaCroatiaCubaCzechoslovakiaDenmarkDominicaDominican RepublicEastern AfricaEastern AsiaEcuadorEgyptEl SalvadorEnglandEritreaEthiopiaEuropeFijiFranceGermanyGhanaGreeceGrenadaGuatemalaGuyanaHaitiHondurasHong KongHungaryIndiaIndonesiaIranIraqIrelandIsraelItalyJamaicaJapanJordanKazakhstanKenyaKoreaKuwaitLaosLatin AmericaLatviaLebanonLiberiaLithuaniaMalaysiaMexicoMicronesiaMiddle AfricaMoldovaMoroccoNepalNetherlandsNicaraguaNigeriaNorth AmericaNorth MacedoniaNorthern AfricaNorthern EuropeNorwayOceaniaPakistanPanamaPeruPhilippinesPolandPortugalRomaniaRussiaSaudi ArabiaScotlandSenegalSerbiaSierra LeoneSingaporeSomaliaSouth AfricaSouth AmericaSouth Central AsiaSouth Eastern AsiaSouthern EuropeSpainSri LankaSt. Vincent and the GrenadinesSudanSwedenSwitzerlandSyriaTaiwanThailandTrinidad and TobagoTurkeyUgandaUkraineUruguayUzbekistanVenezuelaVietnamWest IndiesWestern AfricaWestern AsiaWestern EuropeYemenZaireZimbabweAzores
Immigrants from Eastern Europe
Race
Ancestry
AfghanAfricanAlaska NativeAlaskan AthabascanAlbanianAleutAlsatianAmericanApacheArabArapahoArgentineanArmenianAssyrian/Chaldean/SyriacAustralianAustrianBahamianBangladeshiBarbadianBasqueBelgianBelizeanBermudanBhutaneseBlackfeetBolivianBrazilianBritishBritish West IndianBulgarianBurmeseCajunCambodianCanadianCape VerdeanCarpatho RusynCelticCentral AmericanCentral American IndianCherokeeCheyenneChickasawChileanChineseChippewaChoctawColombianColvilleComancheCosta RicanCreeCreekCroatianCrowCubanCypriotCzechCzechoslovakianDanishDelawareDominicanDutchDutch West IndianEastern EuropeanEcuadorianEgyptianEnglishEstonianEthiopianEuropeanFijianFilipinoFinnishFrenchFrench American IndianFrench CanadianGermanGerman RussianGhanaianGreekGuamanian/ChamorroGuatemalanGuyaneseHaitianHmongHonduranHopiHoumaHungarianIcelanderIndian (Asian)IndonesianInupiatIranianIraqiIrishIroquoisIsraeliItalianJamaicanJapaneseJordanianKenyanKiowaKoreanLaotianLatvianLebaneseLiberianLithuanianLumbeeLuxembourgerMacedonianMalaysianMalteseMarshalleseMenomineeMexicanMexican American IndianMongolianMoroccanNative HawaiianNavajoNepaleseNew ZealanderNicaraguanNigerianNorthern EuropeanNorwegianOkinawanOsageOttawaPaiutePakistaniPalestinianPanamanianParaguayanPennsylvania GermanPeruvianPimaPolishPortuguesePotawatomiPuebloPuerto RicanPuget Sound SalishRomanianRussianSalvadoranSamoanScandinavianScotch-IrishScottishSeminoleSenegaleseSerbianShoshoneSierra LeoneanSiouxSlavicSlovakSloveneSomaliSouth AfricanSouth AmericanSouth American IndianSoviet UnionSpaniardSpanishSpanish AmericanSpanish American IndianSri LankanSubsaharan AfricanSudaneseSwedishSwissSyrianTaiwaneseThaiTlingit-HaidaTohono O'OdhamTonganTrinidadian and TobagonianTsimshianTurkishU.S. Virgin IslanderUgandanUkrainianUruguayanUteVenezuelanVietnameseWelshWest IndianYakamaYugoslavianYumanYup'ikZimbabwean
Immigration
NonimmigrantsImmigrantsAfghanistanAfricaAlbaniaArgentinaArmeniaAsiaAustraliaAustriaBahamasBangladeshBarbadosBelarusBelgiumBelizeBoliviaBosnia and HerzegovinaBrazilBulgariaBurma/MyanmarCabo VerdeCambodiaCameroonCanadaCaribbeanCentral AmericaChileChinaColombiaCongoCosta RicaCroatiaCubaCzechoslovakiaDenmarkDominicaDominican RepublicEastern AfricaEastern AsiaEastern EuropeEcuadorEgyptEl SalvadorEnglandEritreaEthiopiaEuropeFijiFranceGermanyGhanaGreeceGrenadaGuatemalaGuyanaHaitiHondurasHong KongHungaryIndiaIndonesiaIranIraqIrelandIsraelItalyJamaicaJapanJordanKazakhstanKenyaKoreaKuwaitLaosLatin AmericaLatviaLebanonLiberiaLithuaniaMalaysiaMexicoMicronesiaMiddle AfricaMoldovaMoroccoNepalNetherlandsNicaraguaNigeriaNorth AmericaNorth MacedoniaNorthern AfricaNorthern EuropeNorwayOceaniaPakistanPanamaPeruPhilippinesPolandPortugalRomaniaRussiaSaudi ArabiaScotlandSenegalSerbiaSierra LeoneSingaporeSomaliaSouth AfricaSouth AmericaSouth Central AsiaSouth Eastern AsiaSouthern EuropeSpainSri LankaSt. Vincent and the GrenadinesSudanSwedenSwitzerlandSyriaTaiwanThailandTrinidad and TobagoTurkeyUgandaUkraineUruguayUzbekistanVenezuelaVietnamWest IndiesWestern AfricaWestern AsiaWestern EuropeYemenZaireZimbabweAzores
Per Capita Income
Income
Poverty
Unemployment
Labor Participation
Family Structure
Vehicle Availability
Education Level
Disability

Per Capita Income Comparison

Yaqui

Immigrants from Eastern Europe

Tragic
Exceptional
$36,112
PER CAPITA INCOME
0.0/ 100
METRIC RATING
315th/ 347
METRIC RANK
$49,316
PER CAPITA INCOME
99.8/ 100
METRIC RATING
70th/ 347
METRIC RANK

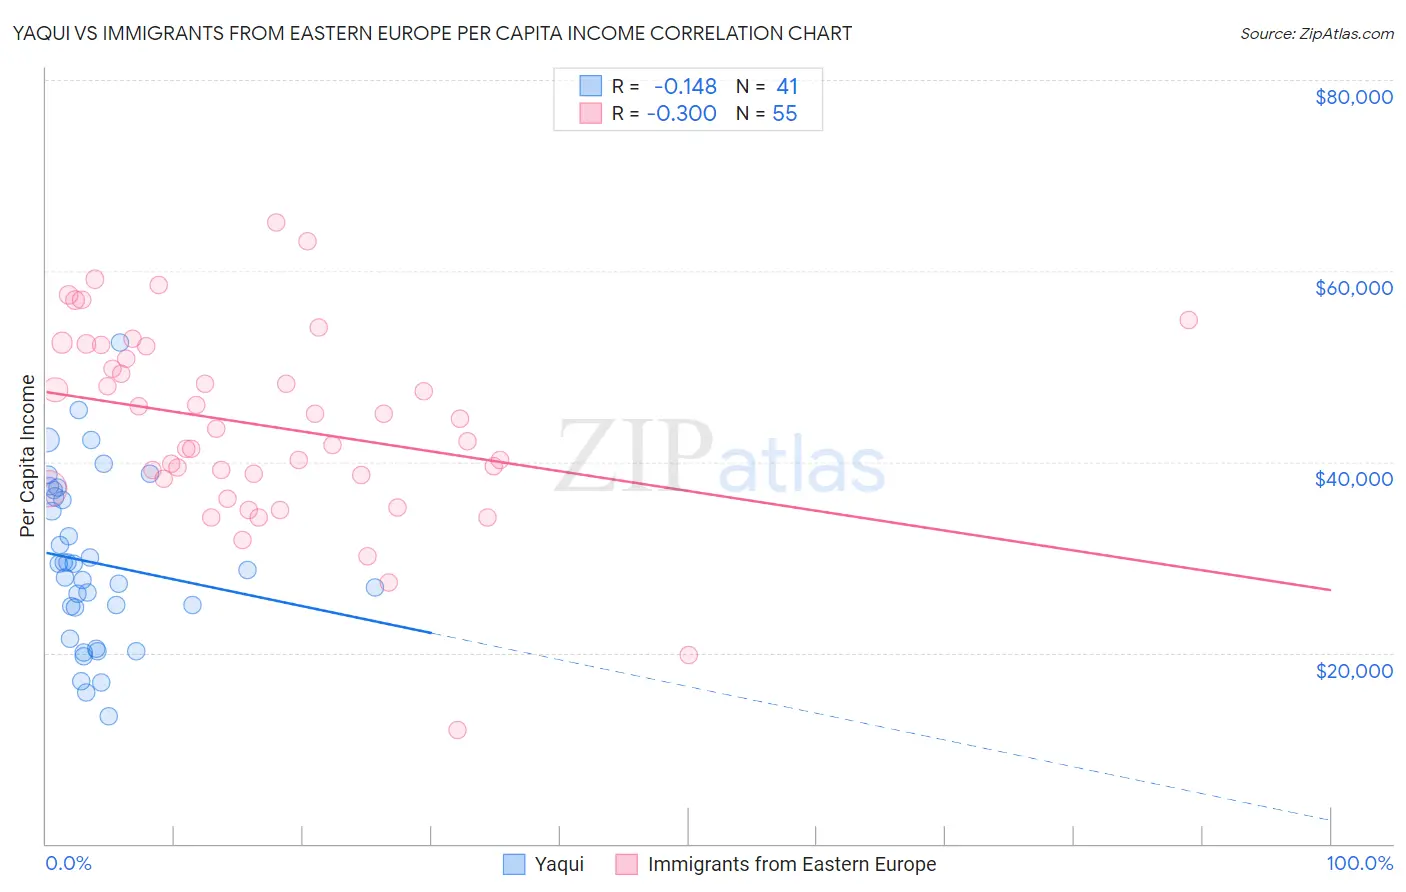
Yaqui vs Immigrants from Eastern Europe Per Capita Income Correlation Chart

The statistical analysis conducted on geographies consisting of 107,738,640 people shows a poor negative correlation between the proportion of Yaqui and per capita income in the United States with a correlation coefficient (R) of -0.148 and weighted average of $36,112. Similarly, the statistical analysis conducted on geographies consisting of 475,909,119 people shows a mild negative correlation between the proportion of Immigrants from Eastern Europe and per capita income in the United States with a correlation coefficient (R) of -0.300 and weighted average of $49,316, a difference of 36.6%.
Yaqui vs Immigrants from Eastern Europe Per Capita Income

Per Capita Income Correlation Summary

MeasurementYaquiImmigrants from Eastern Europe
Minimum$13,349$11,876
Maximum$52,546$65,115
Range$39,197$53,239
Mean$29,404$43,803
Median$28,671$43,497
Interquartile 25% (IQ1)$23,138$38,232
Interquartile 75% (IQ3)$36,720$52,105
Interquartile Range (IQR)$13,582$13,872
Standard Deviation (Sample)$8,788$10,236
Standard Deviation (Population)$8,680$10,143

Similar Demographics by Per Capita Income

Demographics Similar to Yaqui by Per Capita Income

In terms of per capita income, the demographic groups most similar to Yaqui are Seminole ($36,180, a difference of 0.19%), Choctaw ($35,999, a difference of 0.31%), Dutch West Indian ($35,922, a difference of 0.53%), Bangladeshi ($35,897, a difference of 0.60%), and Bahamian ($36,427, a difference of 0.87%).
DemographicsRating | RankPer Capita Income
Fijians
0.0
/100
|
#308
Tragic
$36,690
Immigrants | Honduras
0.0
/100
|
#309
Tragic
$36,665
Ute
0.0
/100
|
#310
Tragic
$36,651
Chippewa
0.0
/100
|
#311
Tragic
$36,631
Chickasaw
0.0
/100
|
#312
Tragic
$36,475
Bahamians
0.0
/100
|
#313
Tragic
$36,427
Seminole
0.0
/100
|
#314
Tragic
$36,180
Yaqui
0.0
/100
|
#315
Tragic
$36,112
Choctaw
0.0
/100
|
#316
Tragic
$35,999
Dutch West Indians
0.0
/100
|
#317
Tragic
$35,922
Bangladeshis
0.0
/100
|
#318
Tragic
$35,897
Immigrants | Congo
0.0
/100
|
#319
Tragic
$35,720
Hispanics or Latinos
0.0
/100
|
#320
Tragic
$35,688
Blacks/African Americans
0.0
/100
|
#321
Tragic
$35,564
Creek
0.0
/100
|
#322
Tragic
$35,546

Demographics Similar to Immigrants from Eastern Europe by Per Capita Income

In terms of per capita income, the demographic groups most similar to Immigrants from Eastern Europe are Greek ($49,309, a difference of 0.010%), Immigrants from Hungary ($49,303, a difference of 0.030%), Immigrants from North America ($49,302, a difference of 0.030%), Immigrants from Canada ($49,412, a difference of 0.20%), and Lithuanian ($49,448, a difference of 0.27%).
DemographicsRating | RankPer Capita Income
Maltese
99.9
/100
|
#63
Exceptional
$49,640
Immigrants | Argentina
99.9
/100
|
#64
Exceptional
$49,627
Bolivians
99.9
/100
|
#65
Exceptional
$49,526
Immigrants | Bulgaria
99.9
/100
|
#66
Exceptional
$49,482
Immigrants | Romania
99.9
/100
|
#67
Exceptional
$49,463
Lithuanians
99.8
/100
|
#68
Exceptional
$49,448
Immigrants | Canada
99.8
/100
|
#69
Exceptional
$49,412
Immigrants | Eastern Europe
99.8
/100
|
#70
Exceptional
$49,316
Greeks
99.8
/100
|
#71
Exceptional
$49,309
Immigrants | Hungary
99.8
/100
|
#72
Exceptional
$49,303
Immigrants | North America
99.8
/100
|
#73
Exceptional
$49,302
Mongolians
99.8
/100
|
#74
Exceptional
$49,173
Immigrants | Bolivia
99.7
/100
|
#75
Exceptional
$48,970
Immigrants | England
99.7
/100
|
#76
Exceptional
$48,844
Immigrants | Kazakhstan
99.7
/100
|
#77
Exceptional
$48,747