Yaqui vs Carpatho Rusyn Per Capita Income
COMPARE
Yaqui
Carpatho Rusyn
Per Capita Income
Per Capita Income Comparison
Yaqui
Carpatho Rusyns
$36,112
PER CAPITA INCOME
0.0/ 100
METRIC RATING
315th/ 347
METRIC RANK
$47,248
PER CAPITA INCOME
98.2/ 100
METRIC RATING
97th/ 347
METRIC RANK
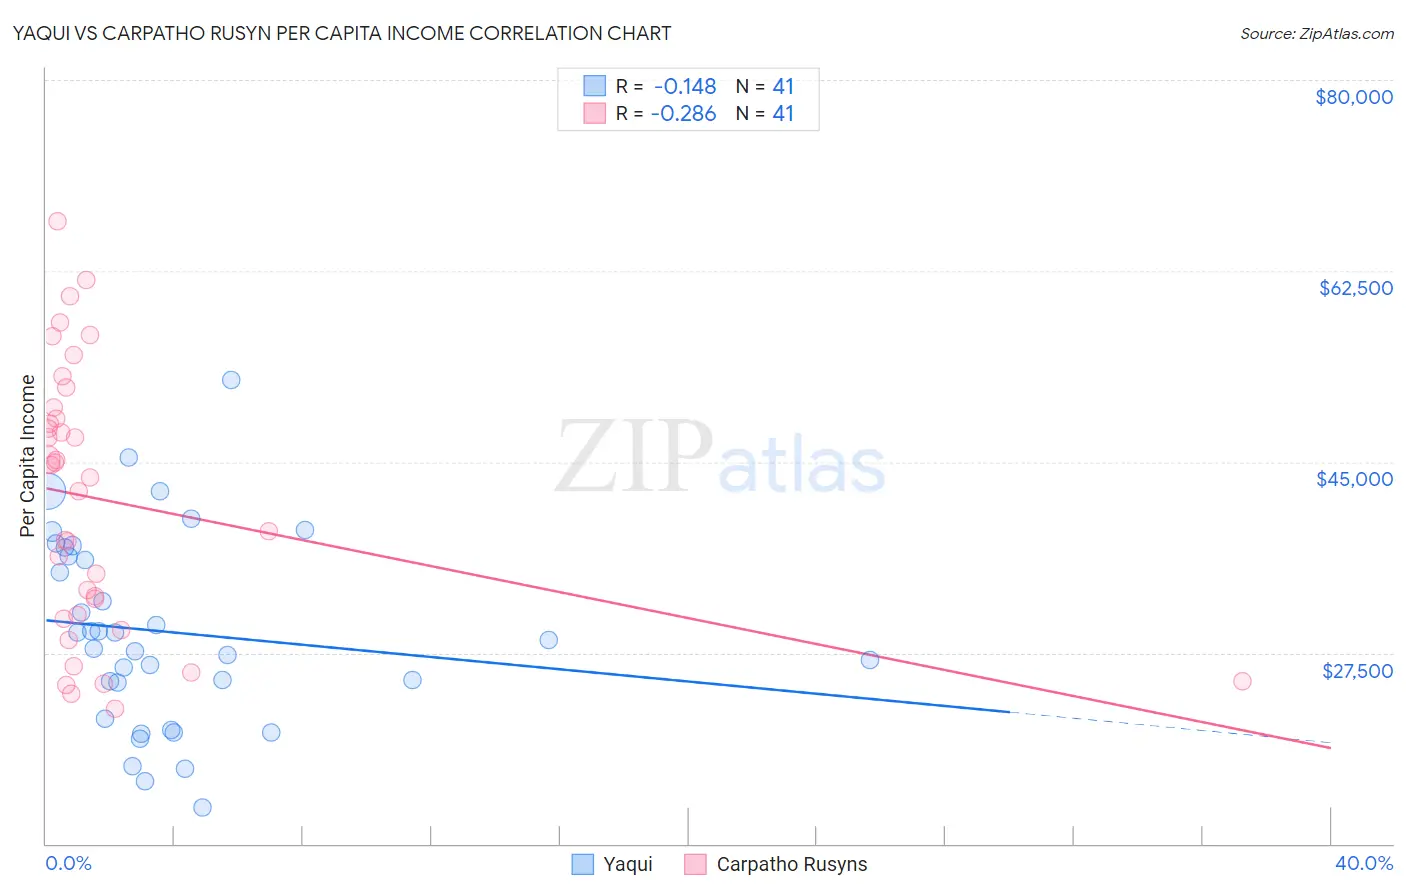
Yaqui vs Carpatho Rusyn Per Capita Income Correlation Chart
The statistical analysis conducted on geographies consisting of 107,738,640 people shows a poor negative correlation between the proportion of Yaqui and per capita income in the United States with a correlation coefficient (R) of -0.148 and weighted average of $36,112. Similarly, the statistical analysis conducted on geographies consisting of 58,866,831 people shows a weak negative correlation between the proportion of Carpatho Rusyns and per capita income in the United States with a correlation coefficient (R) of -0.286 and weighted average of $47,248, a difference of 30.8%.
Per Capita Income Correlation Summary
| Measurement | Yaqui | Carpatho Rusyn |
| Minimum | $13,349 | $22,343 |
| Maximum | $52,546 | $67,093 |
| Range | $39,197 | $44,750 |
| Mean | $29,404 | $41,437 |
| Median | $28,671 | $43,602 |
| Interquartile 25% (IQ1) | $23,138 | $30,789 |
| Interquartile 75% (IQ3) | $36,720 | $49,474 |
| Interquartile Range (IQR) | $13,582 | $18,684 |
| Standard Deviation (Sample) | $8,788 | $12,046 |
| Standard Deviation (Population) | $8,680 | $11,898 |
Similar Demographics by Per Capita Income
Demographics Similar to Yaqui by Per Capita Income
In terms of per capita income, the demographic groups most similar to Yaqui are Seminole ($36,180, a difference of 0.19%), Choctaw ($35,999, a difference of 0.31%), Dutch West Indian ($35,922, a difference of 0.53%), Bangladeshi ($35,897, a difference of 0.60%), and Bahamian ($36,427, a difference of 0.87%).
| Demographics | Rating | Rank | Per Capita Income |
| Fijians | 0.0 /100 | #308 | Tragic $36,690 |
| Immigrants | Honduras | 0.0 /100 | #309 | Tragic $36,665 |
| Ute | 0.0 /100 | #310 | Tragic $36,651 |
| Chippewa | 0.0 /100 | #311 | Tragic $36,631 |
| Chickasaw | 0.0 /100 | #312 | Tragic $36,475 |
| Bahamians | 0.0 /100 | #313 | Tragic $36,427 |
| Seminole | 0.0 /100 | #314 | Tragic $36,180 |
| Yaqui | 0.0 /100 | #315 | Tragic $36,112 |
| Choctaw | 0.0 /100 | #316 | Tragic $35,999 |
| Dutch West Indians | 0.0 /100 | #317 | Tragic $35,922 |
| Bangladeshis | 0.0 /100 | #318 | Tragic $35,897 |
| Immigrants | Congo | 0.0 /100 | #319 | Tragic $35,720 |
| Hispanics or Latinos | 0.0 /100 | #320 | Tragic $35,688 |
| Blacks/African Americans | 0.0 /100 | #321 | Tragic $35,564 |
| Creek | 0.0 /100 | #322 | Tragic $35,546 |
Demographics Similar to Carpatho Rusyns by Per Capita Income
In terms of per capita income, the demographic groups most similar to Carpatho Rusyns are Alsatian ($47,284, a difference of 0.080%), Immigrants from Egypt ($47,361, a difference of 0.24%), Albanian ($47,379, a difference of 0.28%), Immigrants from Zimbabwe ($47,394, a difference of 0.31%), and Immigrants from Pakistan ($47,084, a difference of 0.35%).
| Demographics | Rating | Rank | Per Capita Income |
| Italians | 98.8 /100 | #90 | Exceptional $47,574 |
| Macedonians | 98.8 /100 | #91 | Exceptional $47,573 |
| Immigrants | Moldova | 98.7 /100 | #92 | Exceptional $47,489 |
| Immigrants | Zimbabwe | 98.5 /100 | #93 | Exceptional $47,394 |
| Albanians | 98.5 /100 | #94 | Exceptional $47,379 |
| Immigrants | Egypt | 98.5 /100 | #95 | Exceptional $47,361 |
| Alsatians | 98.3 /100 | #96 | Exceptional $47,284 |
| Carpatho Rusyns | 98.2 /100 | #97 | Exceptional $47,248 |
| Immigrants | Pakistan | 97.9 /100 | #98 | Exceptional $47,084 |
| Laotians | 97.8 /100 | #99 | Exceptional $47,041 |
| Immigrants | Lebanon | 97.5 /100 | #100 | Exceptional $46,938 |
| Immigrants | Uzbekistan | 97.5 /100 | #101 | Exceptional $46,929 |
| Immigrants | Western Asia | 97.4 /100 | #102 | Exceptional $46,876 |
| Syrians | 97.2 /100 | #103 | Exceptional $46,837 |
| Brazilians | 96.8 /100 | #104 | Exceptional $46,700 |