White/Caucasian vs Sudanese Householder Income Under 25 years
COMPARE
White/Caucasian
Sudanese
Householder Income Under 25 years
Householder Income Under 25 years Comparison
Whites/Caucasians
Sudanese
$50,336
HOUSEHOLDER INCOME UNDER 25 YEARS
1.1/ 100
METRIC RATING
258th/ 347
METRIC RANK
$46,982
HOUSEHOLDER INCOME UNDER 25 YEARS
0.0/ 100
METRIC RATING
316th/ 347
METRIC RANK
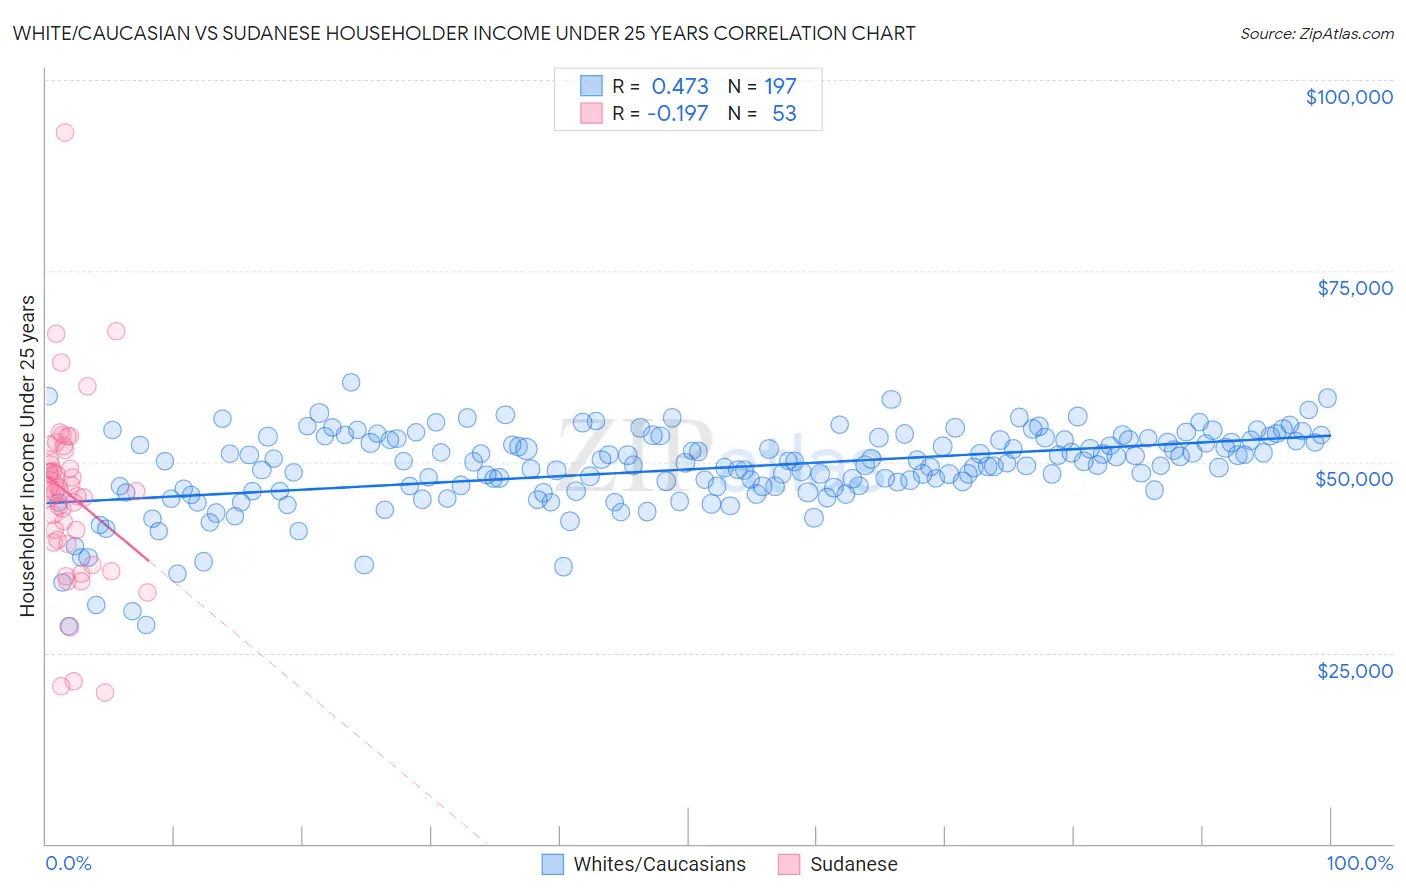
White/Caucasian vs Sudanese Householder Income Under 25 years Correlation Chart
The statistical analysis conducted on geographies consisting of 438,814,939 people shows a moderate positive correlation between the proportion of Whites/Caucasians and household income with householder under the age of 25 in the United States with a correlation coefficient (R) of 0.473 and weighted average of $50,336. Similarly, the statistical analysis conducted on geographies consisting of 104,582,172 people shows a poor negative correlation between the proportion of Sudanese and household income with householder under the age of 25 in the United States with a correlation coefficient (R) of -0.197 and weighted average of $46,982, a difference of 7.1%.
Householder Income Under 25 years Correlation Summary
| Measurement | White/Caucasian | Sudanese |
| Minimum | $28,432 | $19,757 |
| Maximum | $60,456 | $93,063 |
| Range | $32,024 | $73,306 |
| Mean | $49,043 | $45,800 |
| Median | $49,887 | $46,181 |
| Interquartile 25% (IQ1) | $46,371 | $39,636 |
| Interquartile 75% (IQ3) | $52,865 | $50,904 |
| Interquartile Range (IQR) | $6,494 | $11,268 |
| Standard Deviation (Sample) | $5,415 | $11,891 |
| Standard Deviation (Population) | $5,401 | $11,778 |
Similar Demographics by Householder Income Under 25 years
Demographics Similar to Whites/Caucasians by Householder Income Under 25 years
In terms of householder income under 25 years, the demographic groups most similar to Whites/Caucasians are Lebanese ($50,355, a difference of 0.040%), Immigrants from Dominica ($50,301, a difference of 0.070%), Aleut ($50,377, a difference of 0.080%), Immigrants from Cuba ($50,374, a difference of 0.080%), and Luxembourger ($50,379, a difference of 0.090%).
| Demographics | Rating | Rank | Householder Income Under 25 years |
| Celtics | 1.4 /100 | #251 | Tragic $50,447 |
| Immigrants | Mexico | 1.3 /100 | #252 | Tragic $50,422 |
| Immigrants | Haiti | 1.2 /100 | #253 | Tragic $50,398 |
| Luxembourgers | 1.2 /100 | #254 | Tragic $50,379 |
| Aleuts | 1.2 /100 | #255 | Tragic $50,377 |
| Immigrants | Cuba | 1.2 /100 | #256 | Tragic $50,374 |
| Lebanese | 1.1 /100 | #257 | Tragic $50,355 |
| Whites/Caucasians | 1.1 /100 | #258 | Tragic $50,336 |
| Immigrants | Dominica | 1.0 /100 | #259 | Tragic $50,301 |
| Hispanics or Latinos | 0.9 /100 | #260 | Tragic $50,279 |
| Hungarians | 0.9 /100 | #261 | Tragic $50,247 |
| Haitians | 0.8 /100 | #262 | Tragic $50,231 |
| Immigrants | Dominican Republic | 0.8 /100 | #263 | Tragic $50,204 |
| Fijians | 0.6 /100 | #264 | Tragic $50,132 |
| Belgians | 0.6 /100 | #265 | Tragic $50,113 |
Demographics Similar to Sudanese by Householder Income Under 25 years
In terms of householder income under 25 years, the demographic groups most similar to Sudanese are Hopi ($46,978, a difference of 0.010%), Crow ($47,012, a difference of 0.060%), Chippewa ($47,015, a difference of 0.070%), Spanish American ($46,913, a difference of 0.15%), and African ($46,838, a difference of 0.31%).
| Demographics | Rating | Rank | Householder Income Under 25 years |
| U.S. Virgin Islanders | 0.0 /100 | #309 | Tragic $47,448 |
| Iroquois | 0.0 /100 | #310 | Tragic $47,380 |
| Ottawa | 0.0 /100 | #311 | Tragic $47,366 |
| Bermudans | 0.0 /100 | #312 | Tragic $47,359 |
| Delaware | 0.0 /100 | #313 | Tragic $47,159 |
| Chippewa | 0.0 /100 | #314 | Tragic $47,015 |
| Crow | 0.0 /100 | #315 | Tragic $47,012 |
| Sudanese | 0.0 /100 | #316 | Tragic $46,982 |
| Hopi | 0.0 /100 | #317 | Tragic $46,978 |
| Spanish Americans | 0.0 /100 | #318 | Tragic $46,913 |
| Africans | 0.0 /100 | #319 | Tragic $46,838 |
| Immigrants | Sudan | 0.0 /100 | #320 | Tragic $46,791 |
| Potawatomi | 0.0 /100 | #321 | Tragic $46,462 |
| Sioux | 0.0 /100 | #322 | Tragic $46,417 |
| Immigrants | Saudi Arabia | 0.0 /100 | #323 | Tragic $46,187 |