White/Caucasian vs Macedonian Householder Income Under 25 years
COMPARE
White/Caucasian
Macedonian
Householder Income Under 25 years
Householder Income Under 25 years Comparison
Whites/Caucasians
Macedonians
$50,336
HOUSEHOLDER INCOME UNDER 25 YEARS
1.1/ 100
METRIC RATING
258th/ 347
METRIC RANK
$54,563
HOUSEHOLDER INCOME UNDER 25 YEARS
99.7/ 100
METRIC RATING
73rd/ 347
METRIC RANK
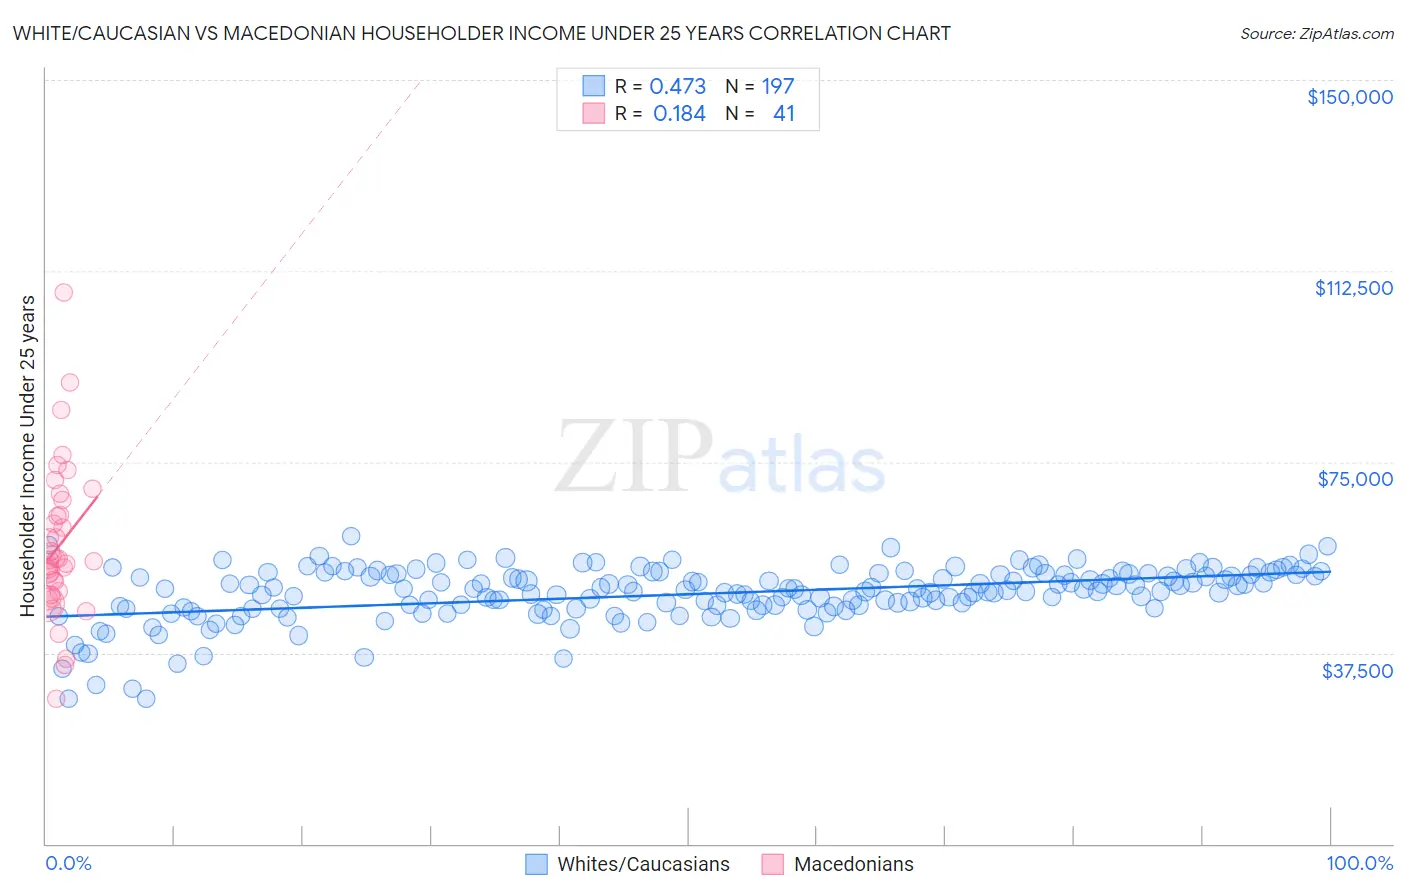
White/Caucasian vs Macedonian Householder Income Under 25 years Correlation Chart
The statistical analysis conducted on geographies consisting of 438,814,939 people shows a moderate positive correlation between the proportion of Whites/Caucasians and household income with householder under the age of 25 in the United States with a correlation coefficient (R) of 0.473 and weighted average of $50,336. Similarly, the statistical analysis conducted on geographies consisting of 119,675,236 people shows a poor positive correlation between the proportion of Macedonians and household income with householder under the age of 25 in the United States with a correlation coefficient (R) of 0.184 and weighted average of $54,563, a difference of 8.4%.
Householder Income Under 25 years Correlation Summary
| Measurement | White/Caucasian | Macedonian |
| Minimum | $28,432 | $28,544 |
| Maximum | $60,456 | $108,182 |
| Range | $32,024 | $79,638 |
| Mean | $49,043 | $58,519 |
| Median | $49,887 | $55,634 |
| Interquartile 25% (IQ1) | $46,371 | $49,194 |
| Interquartile 75% (IQ3) | $52,865 | $66,027 |
| Interquartile Range (IQR) | $6,494 | $16,833 |
| Standard Deviation (Sample) | $5,415 | $14,918 |
| Standard Deviation (Population) | $5,401 | $14,735 |
Similar Demographics by Householder Income Under 25 years
Demographics Similar to Whites/Caucasians by Householder Income Under 25 years
In terms of householder income under 25 years, the demographic groups most similar to Whites/Caucasians are Lebanese ($50,355, a difference of 0.040%), Immigrants from Dominica ($50,301, a difference of 0.070%), Aleut ($50,377, a difference of 0.080%), Immigrants from Cuba ($50,374, a difference of 0.080%), and Luxembourger ($50,379, a difference of 0.090%).
| Demographics | Rating | Rank | Householder Income Under 25 years |
| Celtics | 1.4 /100 | #251 | Tragic $50,447 |
| Immigrants | Mexico | 1.3 /100 | #252 | Tragic $50,422 |
| Immigrants | Haiti | 1.2 /100 | #253 | Tragic $50,398 |
| Luxembourgers | 1.2 /100 | #254 | Tragic $50,379 |
| Aleuts | 1.2 /100 | #255 | Tragic $50,377 |
| Immigrants | Cuba | 1.2 /100 | #256 | Tragic $50,374 |
| Lebanese | 1.1 /100 | #257 | Tragic $50,355 |
| Whites/Caucasians | 1.1 /100 | #258 | Tragic $50,336 |
| Immigrants | Dominica | 1.0 /100 | #259 | Tragic $50,301 |
| Hispanics or Latinos | 0.9 /100 | #260 | Tragic $50,279 |
| Hungarians | 0.9 /100 | #261 | Tragic $50,247 |
| Haitians | 0.8 /100 | #262 | Tragic $50,231 |
| Immigrants | Dominican Republic | 0.8 /100 | #263 | Tragic $50,204 |
| Fijians | 0.6 /100 | #264 | Tragic $50,132 |
| Belgians | 0.6 /100 | #265 | Tragic $50,113 |
Demographics Similar to Macedonians by Householder Income Under 25 years
In terms of householder income under 25 years, the demographic groups most similar to Macedonians are Immigrants from Northern Europe ($54,571, a difference of 0.020%), Immigrants from Grenada ($54,538, a difference of 0.050%), Immigrants from Morocco ($54,593, a difference of 0.060%), Immigrants from El Salvador ($54,599, a difference of 0.070%), and Samoan ($54,610, a difference of 0.090%).
| Demographics | Rating | Rank | Householder Income Under 25 years |
| Immigrants | Bangladesh | 99.8 /100 | #66 | Exceptional $54,714 |
| Okinawans | 99.8 /100 | #67 | Exceptional $54,701 |
| Tsimshian | 99.8 /100 | #68 | Exceptional $54,649 |
| Samoans | 99.7 /100 | #69 | Exceptional $54,610 |
| Immigrants | El Salvador | 99.7 /100 | #70 | Exceptional $54,599 |
| Immigrants | Morocco | 99.7 /100 | #71 | Exceptional $54,593 |
| Immigrants | Northern Europe | 99.7 /100 | #72 | Exceptional $54,571 |
| Macedonians | 99.7 /100 | #73 | Exceptional $54,563 |
| Immigrants | Grenada | 99.7 /100 | #74 | Exceptional $54,538 |
| Immigrants | Sri Lanka | 99.7 /100 | #75 | Exceptional $54,512 |
| Immigrants | Brazil | 99.6 /100 | #76 | Exceptional $54,487 |
| Immigrants | Southern Europe | 99.6 /100 | #77 | Exceptional $54,484 |
| Nepalese | 99.6 /100 | #78 | Exceptional $54,472 |
| Immigrants | Italy | 99.6 /100 | #79 | Exceptional $54,449 |
| Egyptians | 99.6 /100 | #80 | Exceptional $54,444 |