White/Caucasian vs Somali Householder Income Under 25 years
COMPARE
White/Caucasian
Somali
Householder Income Under 25 years
Householder Income Under 25 years Comparison
Whites/Caucasians
Somalis
$50,336
HOUSEHOLDER INCOME UNDER 25 YEARS
1.1/ 100
METRIC RATING
258th/ 347
METRIC RANK
$48,657
HOUSEHOLDER INCOME UNDER 25 YEARS
0.0/ 100
METRIC RATING
294th/ 347
METRIC RANK
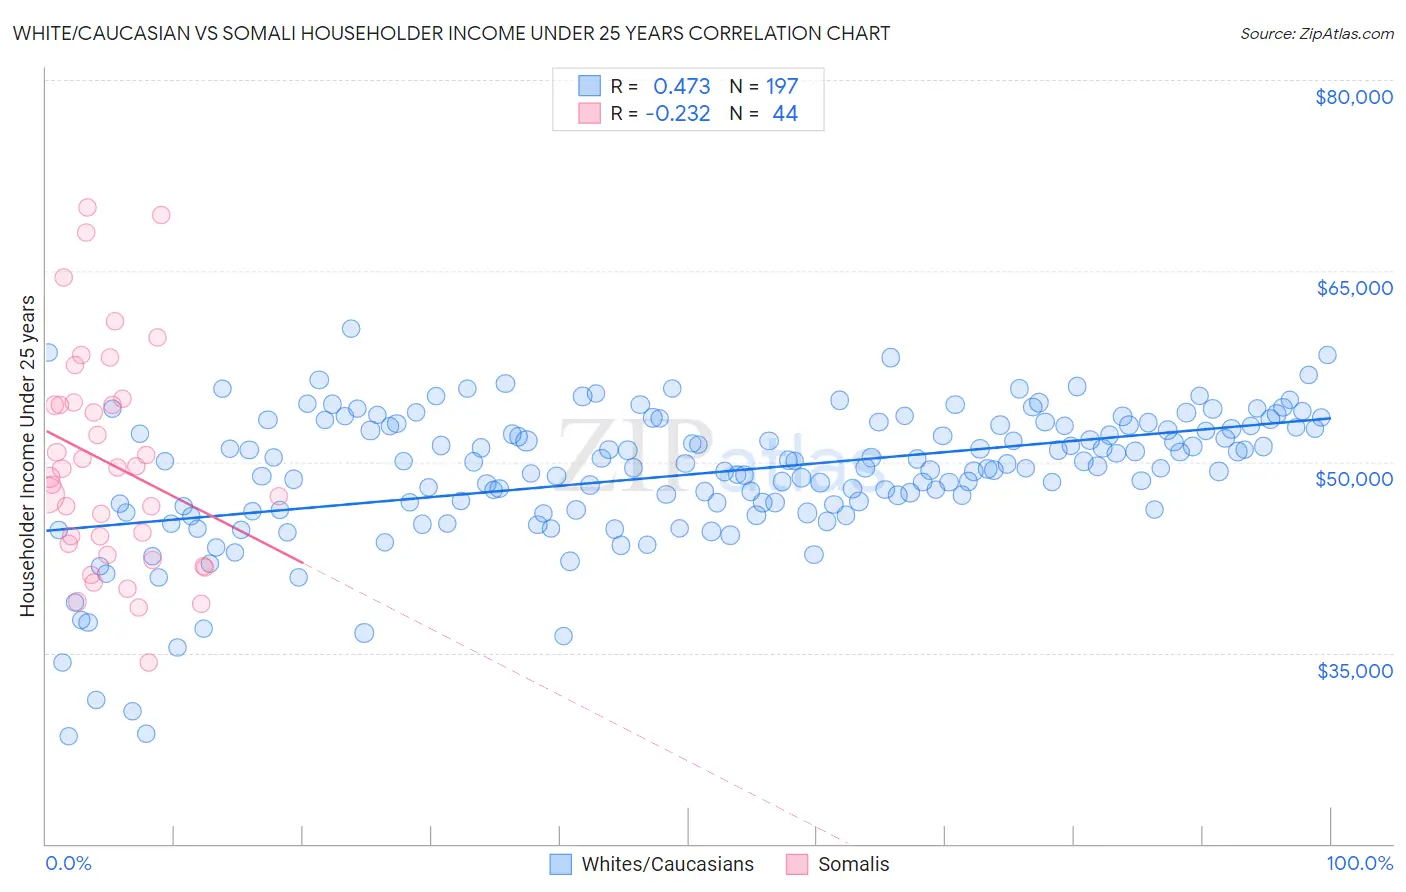
White/Caucasian vs Somali Householder Income Under 25 years Correlation Chart
The statistical analysis conducted on geographies consisting of 438,814,939 people shows a moderate positive correlation between the proportion of Whites/Caucasians and household income with householder under the age of 25 in the United States with a correlation coefficient (R) of 0.473 and weighted average of $50,336. Similarly, the statistical analysis conducted on geographies consisting of 95,208,106 people shows a weak negative correlation between the proportion of Somalis and household income with householder under the age of 25 in the United States with a correlation coefficient (R) of -0.232 and weighted average of $48,657, a difference of 3.5%.
Householder Income Under 25 years Correlation Summary
| Measurement | White/Caucasian | Somali |
| Minimum | $28,432 | $34,250 |
| Maximum | $60,456 | $69,994 |
| Range | $32,024 | $35,744 |
| Mean | $49,043 | $49,862 |
| Median | $49,887 | $49,111 |
| Interquartile 25% (IQ1) | $46,371 | $43,151 |
| Interquartile 75% (IQ3) | $52,865 | $54,604 |
| Interquartile Range (IQR) | $6,494 | $11,452 |
| Standard Deviation (Sample) | $5,415 | $8,614 |
| Standard Deviation (Population) | $5,401 | $8,516 |
Similar Demographics by Householder Income Under 25 years
Demographics Similar to Whites/Caucasians by Householder Income Under 25 years
In terms of householder income under 25 years, the demographic groups most similar to Whites/Caucasians are Lebanese ($50,355, a difference of 0.040%), Immigrants from Dominica ($50,301, a difference of 0.070%), Aleut ($50,377, a difference of 0.080%), Immigrants from Cuba ($50,374, a difference of 0.080%), and Luxembourger ($50,379, a difference of 0.090%).
| Demographics | Rating | Rank | Householder Income Under 25 years |
| Celtics | 1.4 /100 | #251 | Tragic $50,447 |
| Immigrants | Mexico | 1.3 /100 | #252 | Tragic $50,422 |
| Immigrants | Haiti | 1.2 /100 | #253 | Tragic $50,398 |
| Luxembourgers | 1.2 /100 | #254 | Tragic $50,379 |
| Aleuts | 1.2 /100 | #255 | Tragic $50,377 |
| Immigrants | Cuba | 1.2 /100 | #256 | Tragic $50,374 |
| Lebanese | 1.1 /100 | #257 | Tragic $50,355 |
| Whites/Caucasians | 1.1 /100 | #258 | Tragic $50,336 |
| Immigrants | Dominica | 1.0 /100 | #259 | Tragic $50,301 |
| Hispanics or Latinos | 0.9 /100 | #260 | Tragic $50,279 |
| Hungarians | 0.9 /100 | #261 | Tragic $50,247 |
| Haitians | 0.8 /100 | #262 | Tragic $50,231 |
| Immigrants | Dominican Republic | 0.8 /100 | #263 | Tragic $50,204 |
| Fijians | 0.6 /100 | #264 | Tragic $50,132 |
| Belgians | 0.6 /100 | #265 | Tragic $50,113 |
Demographics Similar to Somalis by Householder Income Under 25 years
In terms of householder income under 25 years, the demographic groups most similar to Somalis are Central American Indian ($48,643, a difference of 0.030%), Subsaharan African ($48,691, a difference of 0.070%), Blackfeet ($48,603, a difference of 0.11%), Shoshone ($48,720, a difference of 0.13%), and Immigrants from Burma/Myanmar ($48,749, a difference of 0.19%).
| Demographics | Rating | Rank | Householder Income Under 25 years |
| Senegalese | 0.0 /100 | #287 | Tragic $48,953 |
| Liberians | 0.0 /100 | #288 | Tragic $48,917 |
| Hondurans | 0.0 /100 | #289 | Tragic $48,885 |
| Americans | 0.0 /100 | #290 | Tragic $48,860 |
| Immigrants | Burma/Myanmar | 0.0 /100 | #291 | Tragic $48,749 |
| Shoshone | 0.0 /100 | #292 | Tragic $48,720 |
| Sub-Saharan Africans | 0.0 /100 | #293 | Tragic $48,691 |
| Somalis | 0.0 /100 | #294 | Tragic $48,657 |
| Central American Indians | 0.0 /100 | #295 | Tragic $48,643 |
| Blackfeet | 0.0 /100 | #296 | Tragic $48,603 |
| Cree | 0.0 /100 | #297 | Tragic $48,514 |
| Yaqui | 0.0 /100 | #298 | Tragic $48,300 |
| Immigrants | Honduras | 0.0 /100 | #299 | Tragic $48,267 |
| Immigrants | Somalia | 0.0 /100 | #300 | Tragic $48,135 |
| Immigrants | Kuwait | 0.0 /100 | #301 | Tragic $48,126 |