White/Caucasian vs Indian (Asian) Householder Income Under 25 years
COMPARE
White/Caucasian
Indian (Asian)
Householder Income Under 25 years
Householder Income Under 25 years Comparison
Whites/Caucasians
Indians (Asian)
$50,336
HOUSEHOLDER INCOME UNDER 25 YEARS
1.1/ 100
METRIC RATING
258th/ 347
METRIC RANK
$58,239
HOUSEHOLDER INCOME UNDER 25 YEARS
100.0/ 100
METRIC RATING
8th/ 347
METRIC RANK
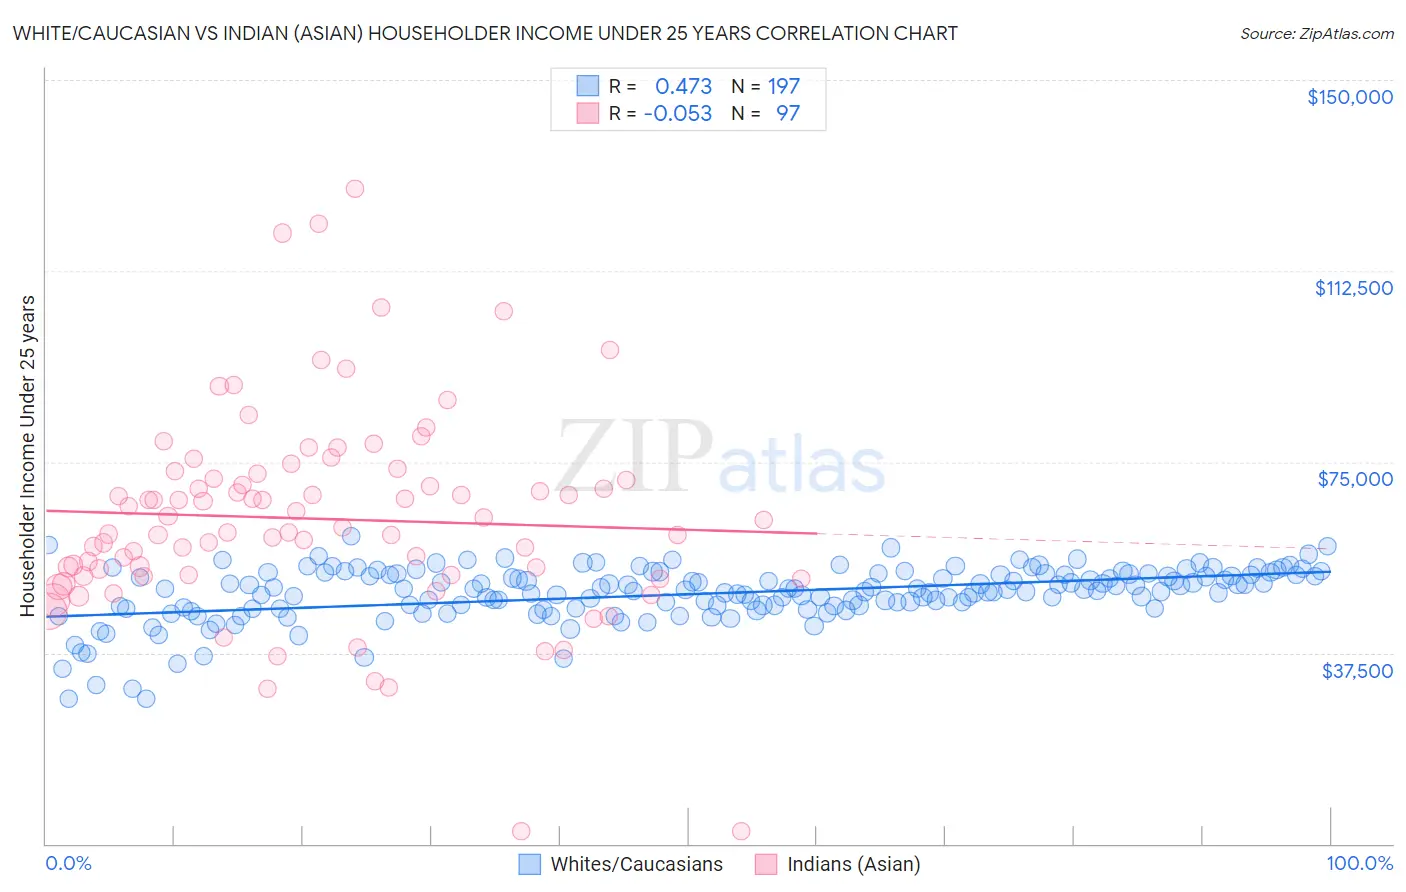
White/Caucasian vs Indian (Asian) Householder Income Under 25 years Correlation Chart
The statistical analysis conducted on geographies consisting of 438,814,939 people shows a moderate positive correlation between the proportion of Whites/Caucasians and household income with householder under the age of 25 in the United States with a correlation coefficient (R) of 0.473 and weighted average of $50,336. Similarly, the statistical analysis conducted on geographies consisting of 402,539,075 people shows a slight negative correlation between the proportion of Indians (Asian) and household income with householder under the age of 25 in the United States with a correlation coefficient (R) of -0.053 and weighted average of $58,239, a difference of 15.7%.
Householder Income Under 25 years Correlation Summary
| Measurement | White/Caucasian | Indian (Asian) |
| Minimum | $28,432 | $2,499 |
| Maximum | $60,456 | $128,558 |
| Range | $32,024 | $126,059 |
| Mean | $49,043 | $63,818 |
| Median | $49,887 | $62,127 |
| Interquartile 25% (IQ1) | $46,371 | $52,606 |
| Interquartile 75% (IQ3) | $52,865 | $72,136 |
| Interquartile Range (IQR) | $6,494 | $19,530 |
| Standard Deviation (Sample) | $5,415 | $20,459 |
| Standard Deviation (Population) | $5,401 | $20,353 |
Similar Demographics by Householder Income Under 25 years
Demographics Similar to Whites/Caucasians by Householder Income Under 25 years
In terms of householder income under 25 years, the demographic groups most similar to Whites/Caucasians are Lebanese ($50,355, a difference of 0.040%), Immigrants from Dominica ($50,301, a difference of 0.070%), Aleut ($50,377, a difference of 0.080%), Immigrants from Cuba ($50,374, a difference of 0.080%), and Luxembourger ($50,379, a difference of 0.090%).
| Demographics | Rating | Rank | Householder Income Under 25 years |
| Celtics | 1.4 /100 | #251 | Tragic $50,447 |
| Immigrants | Mexico | 1.3 /100 | #252 | Tragic $50,422 |
| Immigrants | Haiti | 1.2 /100 | #253 | Tragic $50,398 |
| Luxembourgers | 1.2 /100 | #254 | Tragic $50,379 |
| Aleuts | 1.2 /100 | #255 | Tragic $50,377 |
| Immigrants | Cuba | 1.2 /100 | #256 | Tragic $50,374 |
| Lebanese | 1.1 /100 | #257 | Tragic $50,355 |
| Whites/Caucasians | 1.1 /100 | #258 | Tragic $50,336 |
| Immigrants | Dominica | 1.0 /100 | #259 | Tragic $50,301 |
| Hispanics or Latinos | 0.9 /100 | #260 | Tragic $50,279 |
| Hungarians | 0.9 /100 | #261 | Tragic $50,247 |
| Haitians | 0.8 /100 | #262 | Tragic $50,231 |
| Immigrants | Dominican Republic | 0.8 /100 | #263 | Tragic $50,204 |
| Fijians | 0.6 /100 | #264 | Tragic $50,132 |
| Belgians | 0.6 /100 | #265 | Tragic $50,113 |
Demographics Similar to Indians (Asian) by Householder Income Under 25 years
In terms of householder income under 25 years, the demographic groups most similar to Indians (Asian) are Chinese ($58,162, a difference of 0.13%), Afghan ($58,019, a difference of 0.38%), Bolivian ($58,506, a difference of 0.46%), Immigrants from China ($57,931, a difference of 0.53%), and Immigrants from Philippines ($57,930, a difference of 0.53%).
| Demographics | Rating | Rank | Householder Income Under 25 years |
| Assyrians/Chaldeans/Syriacs | 100.0 /100 | #1 | Exceptional $65,329 |
| Immigrants | Hong Kong | 100.0 /100 | #2 | Exceptional $62,083 |
| Immigrants | India | 100.0 /100 | #3 | Exceptional $59,914 |
| Immigrants | Taiwan | 100.0 /100 | #4 | Exceptional $59,424 |
| Immigrants | Bolivia | 100.0 /100 | #5 | Exceptional $59,389 |
| Thais | 100.0 /100 | #6 | Exceptional $59,187 |
| Bolivians | 100.0 /100 | #7 | Exceptional $58,506 |
| Indians (Asian) | 100.0 /100 | #8 | Exceptional $58,239 |
| Chinese | 100.0 /100 | #9 | Exceptional $58,162 |
| Afghans | 100.0 /100 | #10 | Exceptional $58,019 |
| Immigrants | China | 100.0 /100 | #11 | Exceptional $57,931 |
| Immigrants | Philippines | 100.0 /100 | #12 | Exceptional $57,930 |
| Immigrants | South Central Asia | 100.0 /100 | #13 | Exceptional $57,818 |
| Filipinos | 100.0 /100 | #14 | Exceptional $57,740 |
| Koreans | 100.0 /100 | #15 | Exceptional $57,730 |