Ethiopian vs Immigrants from Syria Median Male Earnings
COMPARE
Ethiopian
Immigrants from Syria
Median Male Earnings
Median Male Earnings Comparison
Ethiopians
Immigrants from Syria
$56,243
MEDIAN MALE EARNINGS
84.8/ 100
METRIC RATING
142nd/ 347
METRIC RANK
$56,830
MEDIAN MALE EARNINGS
90.8/ 100
METRIC RATING
128th/ 347
METRIC RANK
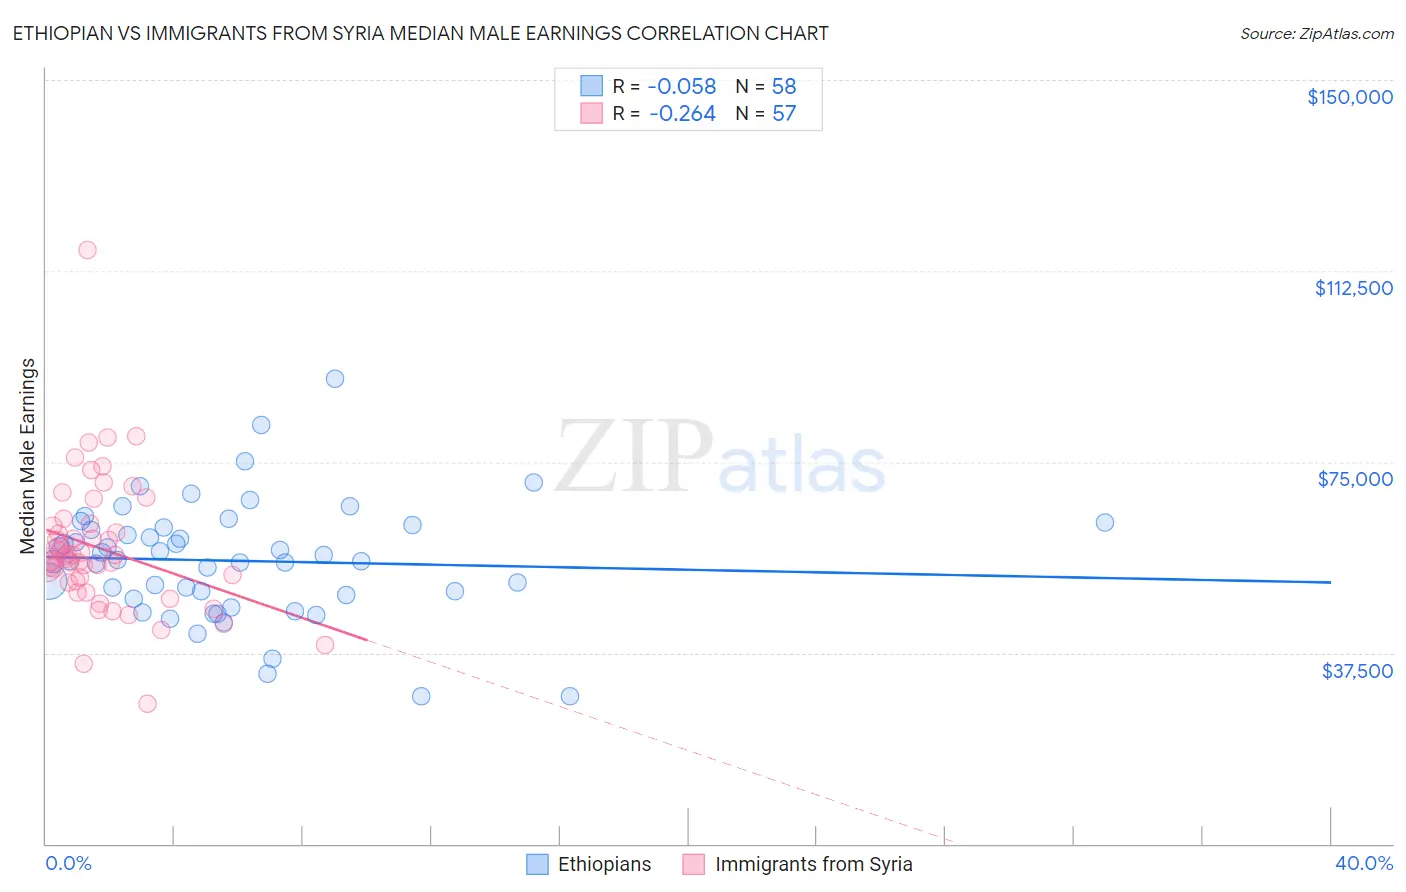
Ethiopian vs Immigrants from Syria Median Male Earnings Correlation Chart
The statistical analysis conducted on geographies consisting of 223,246,505 people shows a slight negative correlation between the proportion of Ethiopians and median male earnings in the United States with a correlation coefficient (R) of -0.058 and weighted average of $56,243. Similarly, the statistical analysis conducted on geographies consisting of 174,082,936 people shows a weak negative correlation between the proportion of Immigrants from Syria and median male earnings in the United States with a correlation coefficient (R) of -0.264 and weighted average of $56,830, a difference of 1.0%.
Median Male Earnings Correlation Summary
| Measurement | Ethiopian | Immigrants from Syria |
| Minimum | $28,882 | $27,500 |
| Maximum | $91,333 | $116,543 |
| Range | $62,451 | $89,043 |
| Mean | $55,598 | $58,068 |
| Median | $55,634 | $56,486 |
| Interquartile 25% (IQ1) | $48,793 | $51,463 |
| Interquartile 75% (IQ3) | $62,132 | $62,640 |
| Interquartile Range (IQR) | $13,339 | $11,177 |
| Standard Deviation (Sample) | $11,505 | $13,292 |
| Standard Deviation (Population) | $11,405 | $13,175 |
Demographics Similar to Ethiopians and Immigrants from Syria by Median Male Earnings
In terms of median male earnings, the demographic groups most similar to Ethiopians are Danish ($56,246, a difference of 0.0%), Zimbabwean ($56,302, a difference of 0.10%), Luxembourger ($56,300, a difference of 0.10%), Slovak ($56,306, a difference of 0.11%), and Sri Lankan ($56,136, a difference of 0.19%). Similarly, the demographic groups most similar to Immigrants from Syria are Brazilian ($56,837, a difference of 0.010%), Chinese ($56,872, a difference of 0.070%), Pakistani ($56,719, a difference of 0.20%), Immigrants from Morocco ($56,958, a difference of 0.23%), and Korean ($56,672, a difference of 0.28%).
| Demographics | Rating | Rank | Median Male Earnings |
| Immigrants | Morocco | 91.8 /100 | #125 | Exceptional $56,958 |
| Chinese | 91.1 /100 | #126 | Exceptional $56,872 |
| Brazilians | 90.9 /100 | #127 | Exceptional $56,837 |
| Immigrants | Syria | 90.8 /100 | #128 | Exceptional $56,830 |
| Pakistanis | 89.9 /100 | #129 | Excellent $56,719 |
| Koreans | 89.4 /100 | #130 | Excellent $56,672 |
| Portuguese | 89.4 /100 | #131 | Excellent $56,663 |
| Czechs | 88.2 /100 | #132 | Excellent $56,546 |
| Immigrants | Germany | 88.2 /100 | #133 | Excellent $56,542 |
| Moroccans | 87.7 /100 | #134 | Excellent $56,499 |
| Irish | 87.4 /100 | #135 | Excellent $56,464 |
| Immigrants | Saudi Arabia | 87.2 /100 | #136 | Excellent $56,452 |
| Slavs | 86.5 /100 | #137 | Excellent $56,390 |
| Slovaks | 85.5 /100 | #138 | Excellent $56,306 |
| Zimbabweans | 85.5 /100 | #139 | Excellent $56,302 |
| Luxembourgers | 85.5 /100 | #140 | Excellent $56,300 |
| Danes | 84.8 /100 | #141 | Excellent $56,246 |
| Ethiopians | 84.8 /100 | #142 | Excellent $56,243 |
| Sri Lankans | 83.4 /100 | #143 | Excellent $56,136 |
| Immigrants | Uganda | 82.4 /100 | #144 | Excellent $56,064 |
| Norwegians | 80.9 /100 | #145 | Excellent $55,965 |