White/Caucasian vs Immigrants from Egypt Median Household Income
COMPARE
White/Caucasian
Immigrants from Egypt
Median Household Income
Median Household Income Comparison
Whites/Caucasians
Immigrants from Egypt
$82,029
MEDIAN HOUSEHOLD INCOME
12.2/ 100
METRIC RATING
218th/ 347
METRIC RANK
$93,700
MEDIAN HOUSEHOLD INCOME
99.6/ 100
METRIC RATING
73rd/ 347
METRIC RANK
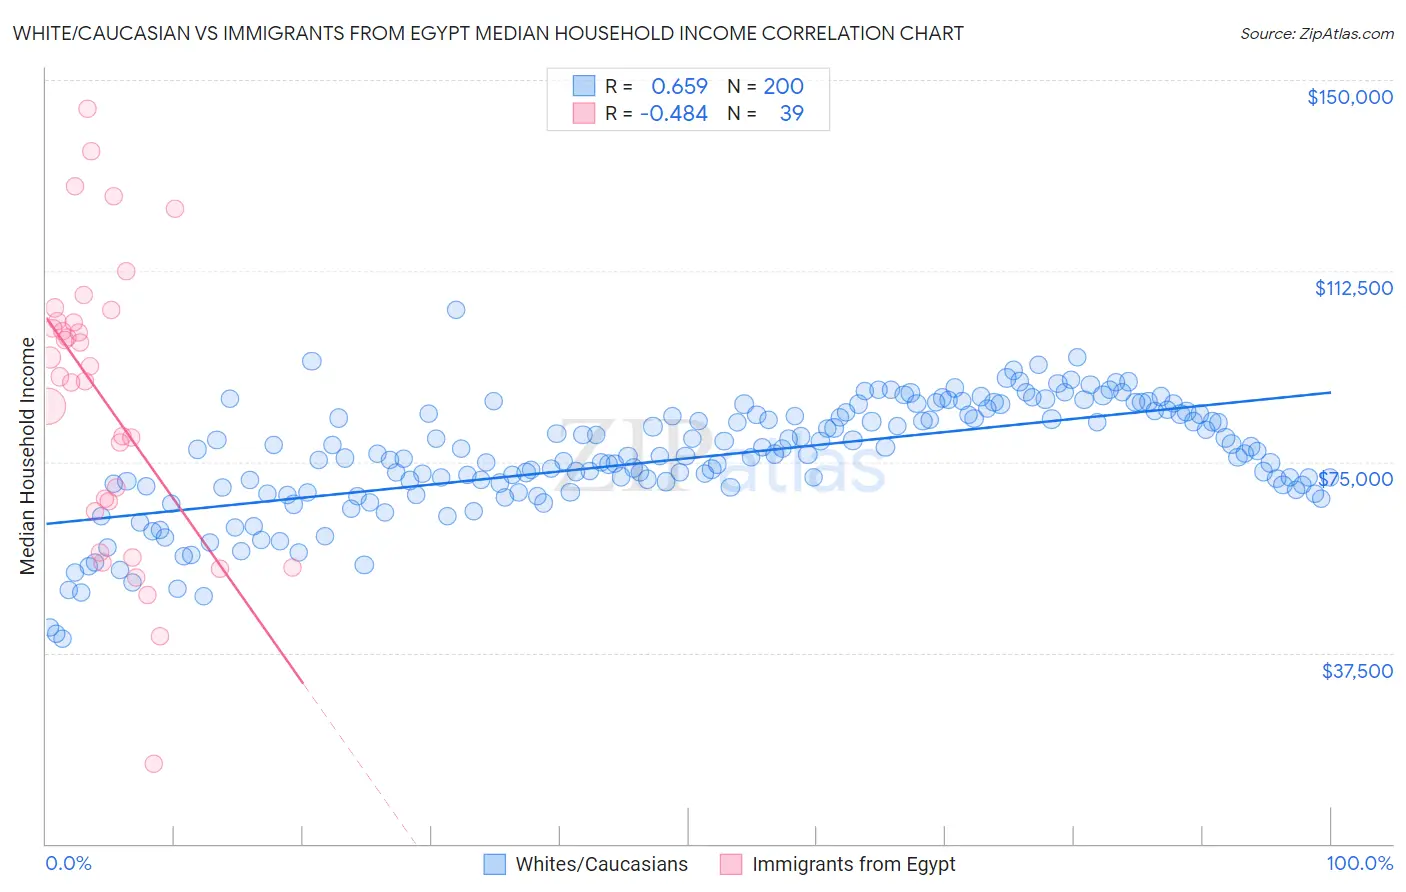
White/Caucasian vs Immigrants from Egypt Median Household Income Correlation Chart
The statistical analysis conducted on geographies consisting of 583,274,044 people shows a significant positive correlation between the proportion of Whites/Caucasians and median household income in the United States with a correlation coefficient (R) of 0.659 and weighted average of $82,029. Similarly, the statistical analysis conducted on geographies consisting of 245,403,618 people shows a moderate negative correlation between the proportion of Immigrants from Egypt and median household income in the United States with a correlation coefficient (R) of -0.484 and weighted average of $93,700, a difference of 14.2%.
Median Household Income Correlation Summary
| Measurement | White/Caucasian | Immigrants from Egypt |
| Minimum | $40,196 | $15,682 |
| Maximum | $104,886 | $144,322 |
| Range | $64,690 | $128,640 |
| Mean | $75,721 | $86,856 |
| Median | $76,251 | $91,717 |
| Interquartile 25% (IQ1) | $70,055 | $65,358 |
| Interquartile 75% (IQ3) | $84,369 | $102,559 |
| Interquartile Range (IQR) | $14,314 | $37,201 |
| Standard Deviation (Sample) | $11,326 | $28,300 |
| Standard Deviation (Population) | $11,297 | $27,935 |
Similar Demographics by Median Household Income
Demographics Similar to Whites/Caucasians by Median Household Income
In terms of median household income, the demographic groups most similar to Whites/Caucasians are Ecuadorian ($82,070, a difference of 0.050%), Yugoslavian ($82,186, a difference of 0.19%), Vietnamese ($82,248, a difference of 0.27%), Panamanian ($82,272, a difference of 0.30%), and Nigerian ($81,725, a difference of 0.37%).
| Demographics | Rating | Rank | Median Household Income |
| Salvadorans | 15.4 /100 | #211 | Poor $82,449 |
| Venezuelans | 15.3 /100 | #212 | Poor $82,432 |
| Nepalese | 15.1 /100 | #213 | Poor $82,410 |
| Panamanians | 14.0 /100 | #214 | Poor $82,272 |
| Vietnamese | 13.8 /100 | #215 | Poor $82,248 |
| Yugoslavians | 13.3 /100 | #216 | Poor $82,186 |
| Ecuadorians | 12.5 /100 | #217 | Poor $82,070 |
| Whites/Caucasians | 12.2 /100 | #218 | Poor $82,029 |
| Nigerians | 10.3 /100 | #219 | Poor $81,725 |
| Immigrants | Venezuela | 9.0 /100 | #220 | Tragic $81,506 |
| Immigrants | Ghana | 9.0 /100 | #221 | Tragic $81,489 |
| Immigrants | Nigeria | 7.7 /100 | #222 | Tragic $81,236 |
| Immigrants | El Salvador | 7.6 /100 | #223 | Tragic $81,213 |
| Malaysians | 7.0 /100 | #224 | Tragic $81,064 |
| Scotch-Irish | 6.6 /100 | #225 | Tragic $80,972 |
Demographics Similar to Immigrants from Egypt by Median Household Income
In terms of median household income, the demographic groups most similar to Immigrants from Egypt are Immigrants from Latvia ($93,602, a difference of 0.10%), Lithuanian ($93,852, a difference of 0.16%), Immigrants from Philippines ($93,899, a difference of 0.21%), Immigrants from Fiji ($93,933, a difference of 0.25%), and Immigrants from Italy ($93,465, a difference of 0.25%).
| Demographics | Rating | Rank | Median Household Income |
| Immigrants | Romania | 99.7 /100 | #66 | Exceptional $94,222 |
| Immigrants | Scotland | 99.7 /100 | #67 | Exceptional $94,091 |
| Mongolians | 99.7 /100 | #68 | Exceptional $93,971 |
| Argentineans | 99.7 /100 | #69 | Exceptional $93,960 |
| Immigrants | Fiji | 99.7 /100 | #70 | Exceptional $93,933 |
| Immigrants | Philippines | 99.6 /100 | #71 | Exceptional $93,899 |
| Lithuanians | 99.6 /100 | #72 | Exceptional $93,852 |
| Immigrants | Egypt | 99.6 /100 | #73 | Exceptional $93,700 |
| Immigrants | Latvia | 99.6 /100 | #74 | Exceptional $93,602 |
| Immigrants | Italy | 99.5 /100 | #75 | Exceptional $93,465 |
| South Africans | 99.5 /100 | #76 | Exceptional $93,379 |
| Immigrants | Afghanistan | 99.5 /100 | #77 | Exceptional $93,375 |
| Immigrants | Bulgaria | 99.4 /100 | #78 | Exceptional $93,148 |
| Sri Lankans | 99.4 /100 | #79 | Exceptional $93,093 |
| Tongans | 99.4 /100 | #80 | Exceptional $93,076 |