White/Caucasian vs German Median Household Income
COMPARE
White/Caucasian
German
Median Household Income
Median Household Income Comparison
Whites/Caucasians
Germans
$82,029
MEDIAN HOUSEHOLD INCOME
12.2/ 100
METRIC RATING
218th/ 347
METRIC RANK
$83,358
MEDIAN HOUSEHOLD INCOME
24.6/ 100
METRIC RATING
199th/ 347
METRIC RANK
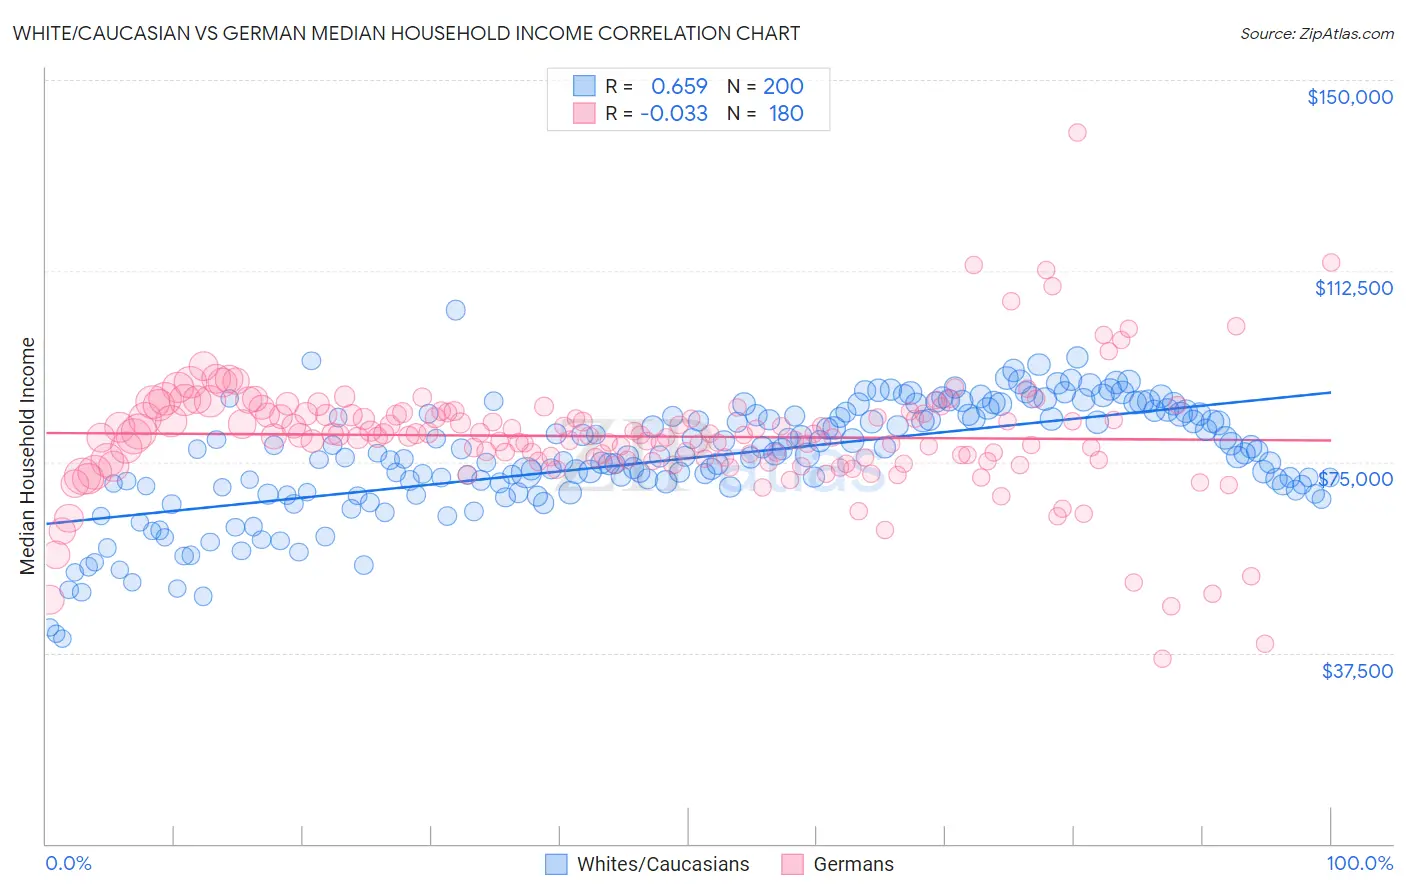
White/Caucasian vs German Median Household Income Correlation Chart
The statistical analysis conducted on geographies consisting of 583,274,044 people shows a significant positive correlation between the proportion of Whites/Caucasians and median household income in the United States with a correlation coefficient (R) of 0.659 and weighted average of $82,029. Similarly, the statistical analysis conducted on geographies consisting of 579,647,874 people shows no correlation between the proportion of Germans and median household income in the United States with a correlation coefficient (R) of -0.033 and weighted average of $83,358, a difference of 1.6%.
Median Household Income Correlation Summary
| Measurement | White/Caucasian | German |
| Minimum | $40,196 | $36,331 |
| Maximum | $104,886 | $139,709 |
| Range | $64,690 | $103,378 |
| Mean | $75,721 | $80,014 |
| Median | $76,251 | $80,167 |
| Interquartile 25% (IQ1) | $70,055 | $75,354 |
| Interquartile 75% (IQ3) | $84,369 | $84,522 |
| Interquartile Range (IQR) | $14,314 | $9,168 |
| Standard Deviation (Sample) | $11,326 | $11,898 |
| Standard Deviation (Population) | $11,297 | $11,865 |
Demographics Similar to Whites/Caucasians and Germans by Median Household Income
In terms of median household income, the demographic groups most similar to Whites/Caucasians are Ecuadorian ($82,070, a difference of 0.050%), Yugoslavian ($82,186, a difference of 0.19%), Vietnamese ($82,248, a difference of 0.27%), Panamanian ($82,272, a difference of 0.30%), and Nepalese ($82,410, a difference of 0.46%). Similarly, the demographic groups most similar to Germans are Tsimshian ($83,346, a difference of 0.010%), Spanish ($83,343, a difference of 0.020%), Japanese ($83,395, a difference of 0.040%), Immigrants from Thailand ($83,327, a difference of 0.040%), and Immigrants from Cambodia ($83,304, a difference of 0.070%).
| Demographics | Rating | Rank | Median Household Income |
| Japanese | 25.1 /100 | #198 | Fair $83,395 |
| Germans | 24.6 /100 | #199 | Fair $83,358 |
| Tsimshian | 24.5 /100 | #200 | Fair $83,346 |
| Spanish | 24.4 /100 | #201 | Fair $83,343 |
| Immigrants | Thailand | 24.3 /100 | #202 | Fair $83,327 |
| Immigrants | Cambodia | 24.0 /100 | #203 | Fair $83,304 |
| Immigrants | Africa | 23.8 /100 | #204 | Fair $83,289 |
| Celtics | 22.7 /100 | #205 | Fair $83,193 |
| Immigrants | Kenya | 21.3 /100 | #206 | Fair $83,068 |
| Dutch | 20.3 /100 | #207 | Fair $82,971 |
| French Canadians | 18.7 /100 | #208 | Poor $82,810 |
| Immigrants | Iraq | 16.7 /100 | #209 | Poor $82,594 |
| Immigrants | Uruguay | 16.4 /100 | #210 | Poor $82,560 |
| Salvadorans | 15.4 /100 | #211 | Poor $82,449 |
| Venezuelans | 15.3 /100 | #212 | Poor $82,432 |
| Nepalese | 15.1 /100 | #213 | Poor $82,410 |
| Panamanians | 14.0 /100 | #214 | Poor $82,272 |
| Vietnamese | 13.8 /100 | #215 | Poor $82,248 |
| Yugoslavians | 13.3 /100 | #216 | Poor $82,186 |
| Ecuadorians | 12.5 /100 | #217 | Poor $82,070 |
| Whites/Caucasians | 12.2 /100 | #218 | Poor $82,029 |