White/Caucasian vs Immigrants from Egypt Male Unemployment
COMPARE
White/Caucasian
Immigrants from Egypt
Male Unemployment
Male Unemployment Comparison
Whites/Caucasians
Immigrants from Egypt
5.0%
MALE UNEMPLOYMENT
97.3/ 100
METRIC RATING
70th/ 347
METRIC RANK
5.2%
MALE UNEMPLOYMENT
65.9/ 100
METRIC RATING
162nd/ 347
METRIC RANK
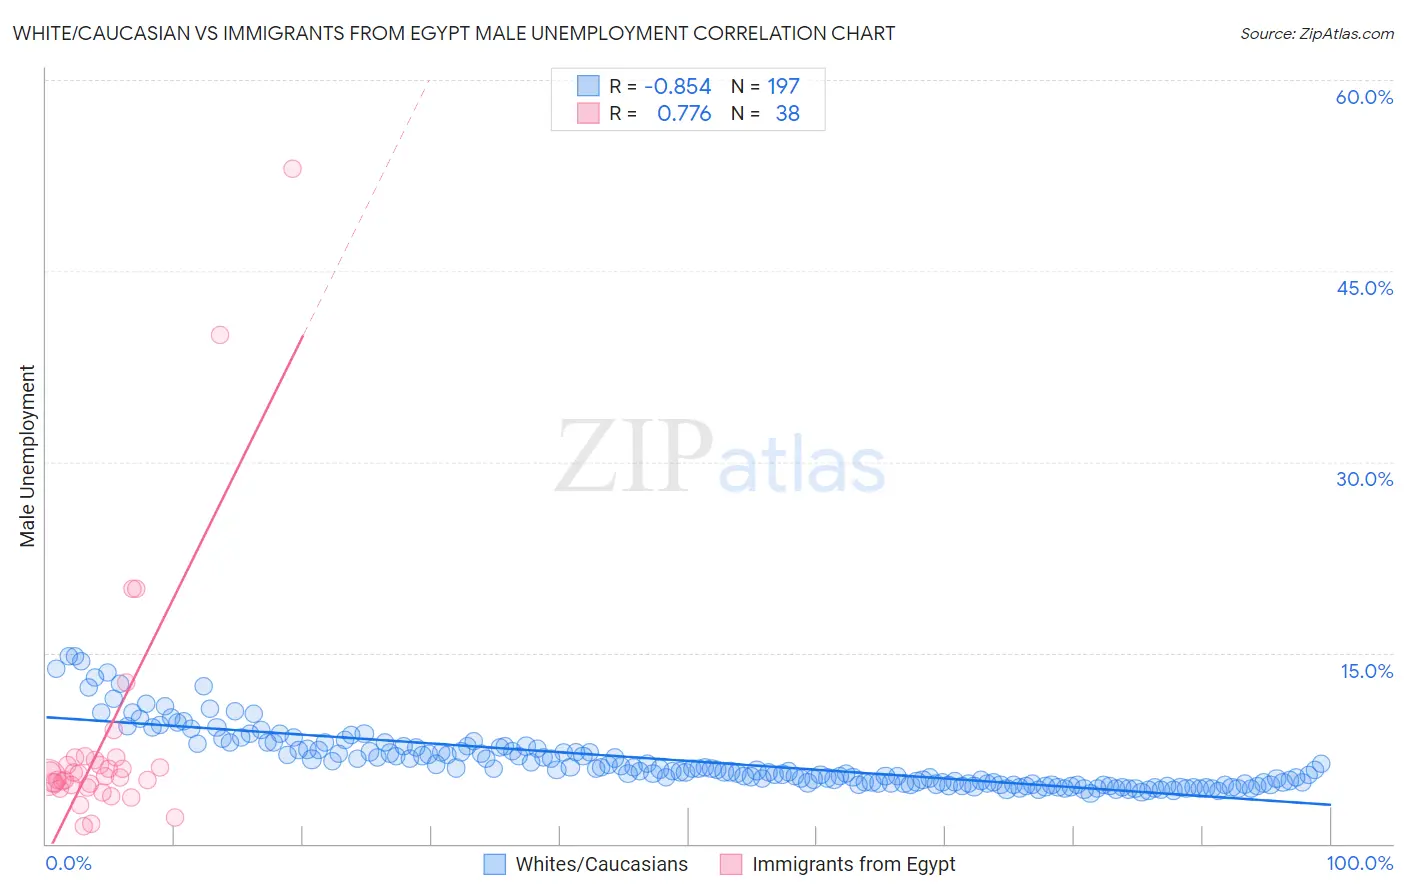
White/Caucasian vs Immigrants from Egypt Male Unemployment Correlation Chart
The statistical analysis conducted on geographies consisting of 569,852,701 people shows a very strong negative correlation between the proportion of Whites/Caucasians and unemployment rate among males in the United States with a correlation coefficient (R) of -0.854 and weighted average of 5.0%. Similarly, the statistical analysis conducted on geographies consisting of 245,171,994 people shows a strong positive correlation between the proportion of Immigrants from Egypt and unemployment rate among males in the United States with a correlation coefficient (R) of 0.776 and weighted average of 5.2%, a difference of 4.5%.
Male Unemployment Correlation Summary
| Measurement | White/Caucasian | Immigrants from Egypt |
| Minimum | 4.0% | 1.4% |
| Maximum | 14.7% | 53.0% |
| Range | 10.8% | 51.6% |
| Mean | 6.5% | 8.2% |
| Median | 5.8% | 5.3% |
| Interquartile 25% (IQ1) | 4.7% | 4.6% |
| Interquartile 75% (IQ3) | 7.4% | 6.6% |
| Interquartile Range (IQR) | 2.7% | 2.0% |
| Standard Deviation (Sample) | 2.3% | 10.0% |
| Standard Deviation (Population) | 2.3% | 9.9% |
Similar Demographics by Male Unemployment
Demographics Similar to Whites/Caucasians by Male Unemployment
In terms of male unemployment, the demographic groups most similar to Whites/Caucasians are New Zealander (5.0%, a difference of 0.020%), Immigrants from Sweden (5.0%, a difference of 0.050%), Australian (5.0%, a difference of 0.080%), Immigrants from Canada (5.0%, a difference of 0.090%), and Immigrants from South Africa (5.0%, a difference of 0.090%).
| Demographics | Rating | Rank | Male Unemployment |
| Eastern Europeans | 97.9 /100 | #63 | Exceptional 5.0% |
| Celtics | 97.8 /100 | #64 | Exceptional 5.0% |
| Icelanders | 97.6 /100 | #65 | Exceptional 5.0% |
| Finns | 97.5 /100 | #66 | Exceptional 5.0% |
| Immigrants | Canada | 97.5 /100 | #67 | Exceptional 5.0% |
| Australians | 97.4 /100 | #68 | Exceptional 5.0% |
| Immigrants | Sweden | 97.4 /100 | #69 | Exceptional 5.0% |
| Whites/Caucasians | 97.3 /100 | #70 | Exceptional 5.0% |
| New Zealanders | 97.3 /100 | #71 | Exceptional 5.0% |
| Immigrants | South Africa | 97.1 /100 | #72 | Exceptional 5.0% |
| Greeks | 97.0 /100 | #73 | Exceptional 5.0% |
| Immigrants | North America | 96.9 /100 | #74 | Exceptional 5.0% |
| Assyrians/Chaldeans/Syriacs | 96.9 /100 | #75 | Exceptional 5.0% |
| Immigrants | Sudan | 96.5 /100 | #76 | Exceptional 5.0% |
| Iranians | 96.4 /100 | #77 | Exceptional 5.0% |
Demographics Similar to Immigrants from Egypt by Male Unemployment
In terms of male unemployment, the demographic groups most similar to Immigrants from Egypt are Immigrants from Hong Kong (5.2%, a difference of 0.010%), Afghan (5.3%, a difference of 0.25%), Immigrants from China (5.2%, a difference of 0.32%), South American (5.3%, a difference of 0.33%), and Immigrants from Norway (5.2%, a difference of 0.35%).
| Demographics | Rating | Rank | Male Unemployment |
| Immigrants | Hungary | 73.4 /100 | #155 | Good 5.2% |
| Americans | 72.7 /100 | #156 | Good 5.2% |
| Immigrants | Northern Africa | 72.3 /100 | #157 | Good 5.2% |
| Immigrants | Indonesia | 71.5 /100 | #158 | Good 5.2% |
| Indonesians | 71.2 /100 | #159 | Good 5.2% |
| Immigrants | Norway | 71.0 /100 | #160 | Good 5.2% |
| Immigrants | China | 70.6 /100 | #161 | Good 5.2% |
| Immigrants | Egypt | 65.9 /100 | #162 | Good 5.2% |
| Immigrants | Hong Kong | 65.7 /100 | #163 | Good 5.2% |
| Afghans | 62.0 /100 | #164 | Good 5.3% |
| South Americans | 60.6 /100 | #165 | Good 5.3% |
| Immigrants | Morocco | 60.2 /100 | #166 | Good 5.3% |
| Immigrants | Vietnam | 58.1 /100 | #167 | Average 5.3% |
| Immigrants | Ireland | 57.7 /100 | #168 | Average 5.3% |
| Immigrants | Congo | 57.4 /100 | #169 | Average 5.3% |