Malaysian vs Immigrants from Egypt Median Household Income
COMPARE
Malaysian
Immigrants from Egypt
Median Household Income
Median Household Income Comparison
Malaysians
Immigrants from Egypt
$81,064
MEDIAN HOUSEHOLD INCOME
7.0/ 100
METRIC RATING
224th/ 347
METRIC RANK
$93,700
MEDIAN HOUSEHOLD INCOME
99.6/ 100
METRIC RATING
73rd/ 347
METRIC RANK
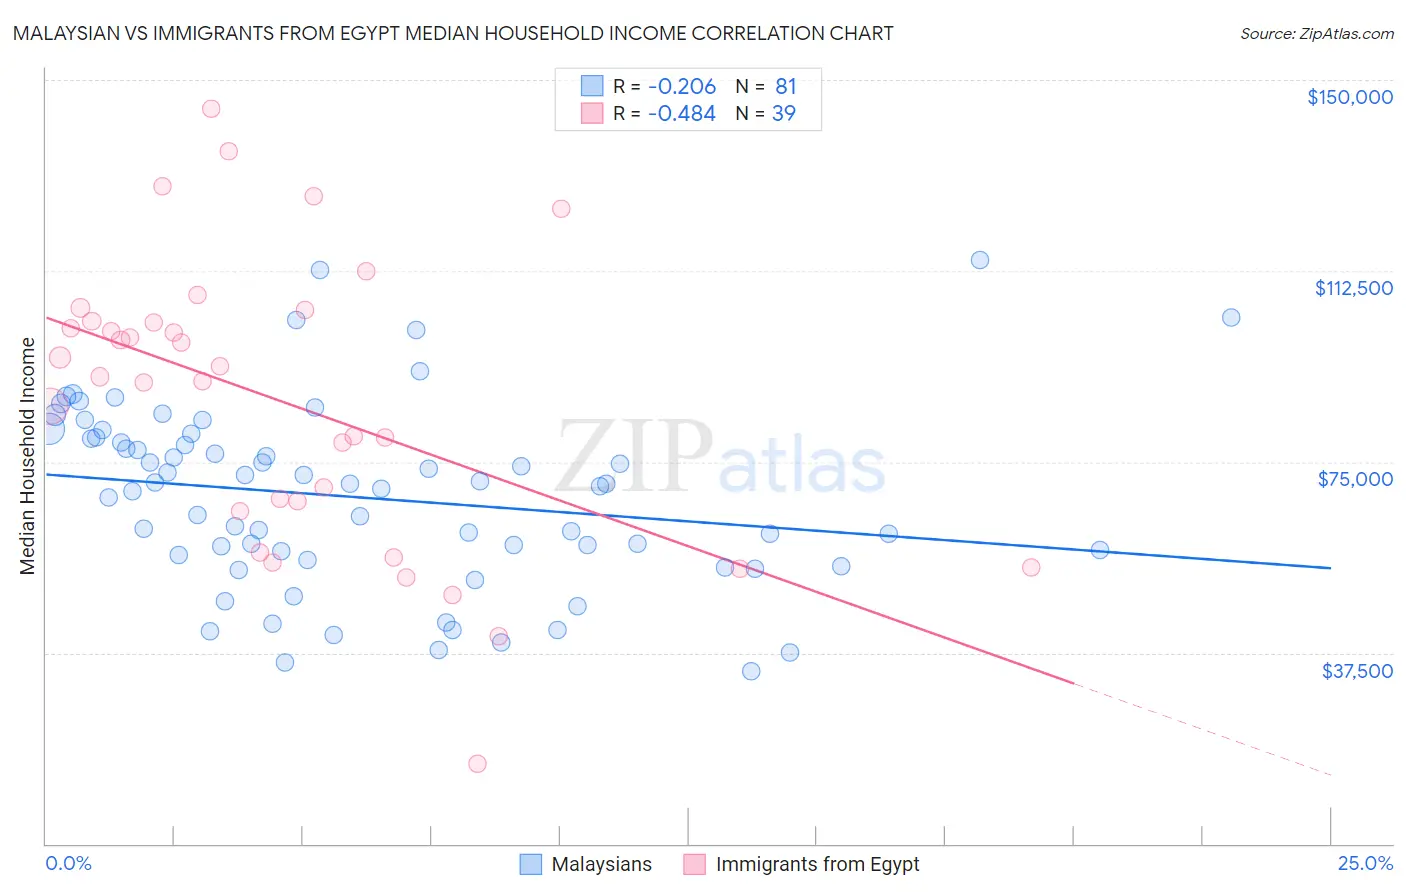
Malaysian vs Immigrants from Egypt Median Household Income Correlation Chart
The statistical analysis conducted on geographies consisting of 225,962,750 people shows a weak negative correlation between the proportion of Malaysians and median household income in the United States with a correlation coefficient (R) of -0.206 and weighted average of $81,064. Similarly, the statistical analysis conducted on geographies consisting of 245,403,618 people shows a moderate negative correlation between the proportion of Immigrants from Egypt and median household income in the United States with a correlation coefficient (R) of -0.484 and weighted average of $93,700, a difference of 15.6%.
Median Household Income Correlation Summary
| Measurement | Malaysian | Immigrants from Egypt |
| Minimum | $33,804 | $15,682 |
| Maximum | $114,680 | $144,322 |
| Range | $80,876 | $128,640 |
| Mean | $68,008 | $86,856 |
| Median | $70,094 | $91,717 |
| Interquartile 25% (IQ1) | $56,150 | $65,358 |
| Interquartile 75% (IQ3) | $79,730 | $102,559 |
| Interquartile Range (IQR) | $23,581 | $37,201 |
| Standard Deviation (Sample) | $17,902 | $28,300 |
| Standard Deviation (Population) | $17,791 | $27,935 |
Similar Demographics by Median Household Income
Demographics Similar to Malaysians by Median Household Income
In terms of median household income, the demographic groups most similar to Malaysians are Scotch-Irish ($80,972, a difference of 0.11%), Immigrants from El Salvador ($81,213, a difference of 0.18%), Immigrants from Nigeria ($81,236, a difference of 0.21%), Immigrants from Panama ($80,873, a difference of 0.24%), and Guyanese ($80,734, a difference of 0.41%).
| Demographics | Rating | Rank | Median Household Income |
| Ecuadorians | 12.5 /100 | #217 | Poor $82,070 |
| Whites/Caucasians | 12.2 /100 | #218 | Poor $82,029 |
| Nigerians | 10.3 /100 | #219 | Poor $81,725 |
| Immigrants | Venezuela | 9.0 /100 | #220 | Tragic $81,506 |
| Immigrants | Ghana | 9.0 /100 | #221 | Tragic $81,489 |
| Immigrants | Nigeria | 7.7 /100 | #222 | Tragic $81,236 |
| Immigrants | El Salvador | 7.6 /100 | #223 | Tragic $81,213 |
| Malaysians | 7.0 /100 | #224 | Tragic $81,064 |
| Scotch-Irish | 6.6 /100 | #225 | Tragic $80,972 |
| Immigrants | Panama | 6.2 /100 | #226 | Tragic $80,873 |
| Guyanese | 5.7 /100 | #227 | Tragic $80,734 |
| Immigrants | Bangladesh | 5.7 /100 | #228 | Tragic $80,722 |
| Delaware | 5.0 /100 | #229 | Tragic $80,527 |
| Bermudans | 4.7 /100 | #230 | Tragic $80,406 |
| Trinidadians and Tobagonians | 4.7 /100 | #231 | Tragic $80,402 |
Demographics Similar to Immigrants from Egypt by Median Household Income
In terms of median household income, the demographic groups most similar to Immigrants from Egypt are Immigrants from Latvia ($93,602, a difference of 0.10%), Lithuanian ($93,852, a difference of 0.16%), Immigrants from Philippines ($93,899, a difference of 0.21%), Immigrants from Fiji ($93,933, a difference of 0.25%), and Immigrants from Italy ($93,465, a difference of 0.25%).
| Demographics | Rating | Rank | Median Household Income |
| Immigrants | Romania | 99.7 /100 | #66 | Exceptional $94,222 |
| Immigrants | Scotland | 99.7 /100 | #67 | Exceptional $94,091 |
| Mongolians | 99.7 /100 | #68 | Exceptional $93,971 |
| Argentineans | 99.7 /100 | #69 | Exceptional $93,960 |
| Immigrants | Fiji | 99.7 /100 | #70 | Exceptional $93,933 |
| Immigrants | Philippines | 99.6 /100 | #71 | Exceptional $93,899 |
| Lithuanians | 99.6 /100 | #72 | Exceptional $93,852 |
| Immigrants | Egypt | 99.6 /100 | #73 | Exceptional $93,700 |
| Immigrants | Latvia | 99.6 /100 | #74 | Exceptional $93,602 |
| Immigrants | Italy | 99.5 /100 | #75 | Exceptional $93,465 |
| South Africans | 99.5 /100 | #76 | Exceptional $93,379 |
| Immigrants | Afghanistan | 99.5 /100 | #77 | Exceptional $93,375 |
| Immigrants | Bulgaria | 99.4 /100 | #78 | Exceptional $93,148 |
| Sri Lankans | 99.4 /100 | #79 | Exceptional $93,093 |
| Tongans | 99.4 /100 | #80 | Exceptional $93,076 |