Ute vs Immigrants from Korea Median Household Income
COMPARE
Ute
Immigrants from Korea
Median Household Income
Median Household Income Comparison
Ute
Immigrants from Korea
$72,402
MEDIAN HOUSEHOLD INCOME
0.0/ 100
METRIC RATING
307th/ 347
METRIC RANK
$102,962
MEDIAN HOUSEHOLD INCOME
100.0/ 100
METRIC RATING
17th/ 347
METRIC RANK
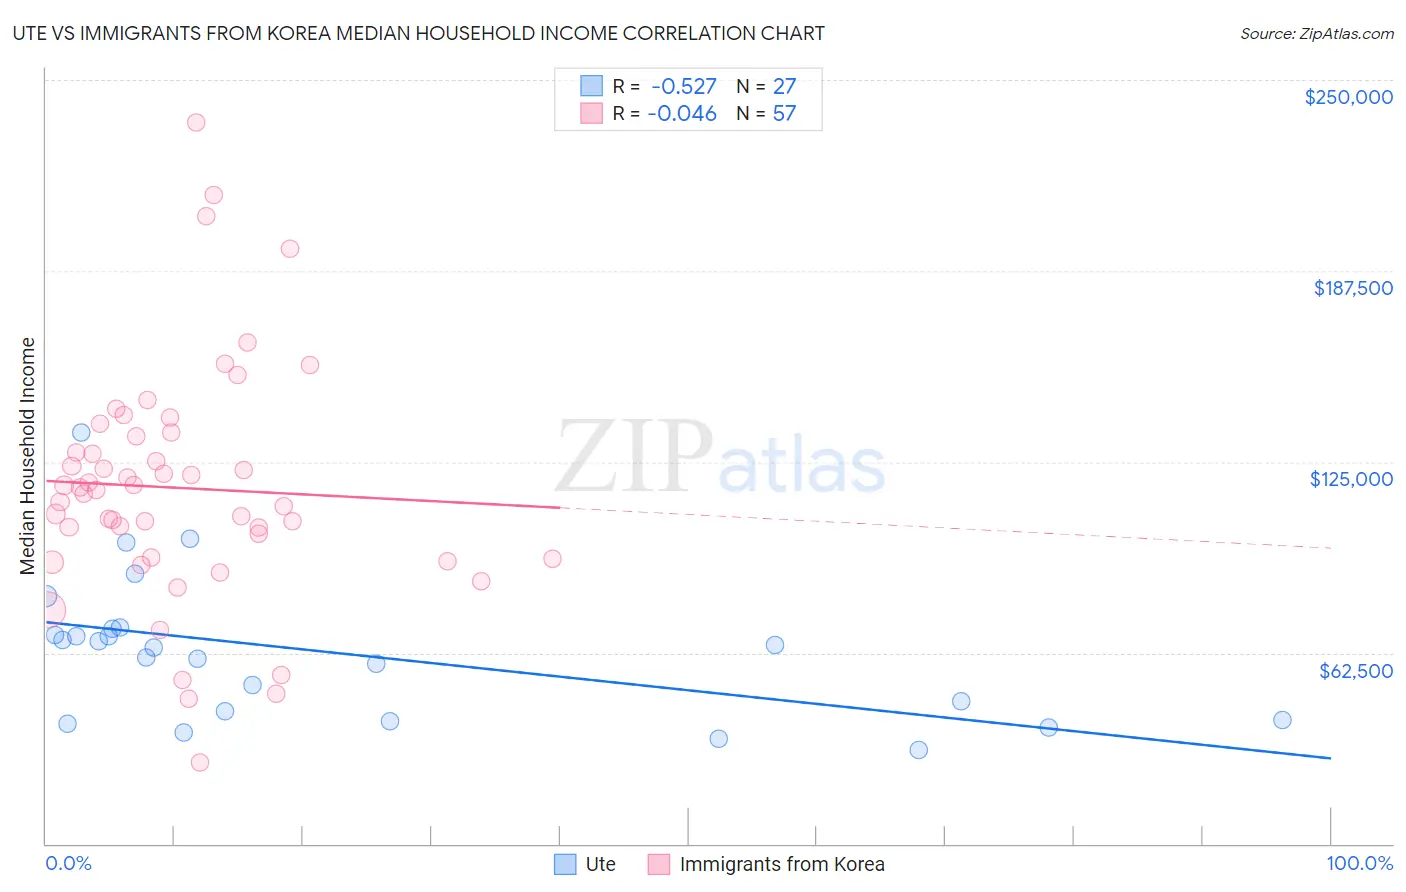
Ute vs Immigrants from Korea Median Household Income Correlation Chart
The statistical analysis conducted on geographies consisting of 55,657,610 people shows a substantial negative correlation between the proportion of Ute and median household income in the United States with a correlation coefficient (R) of -0.527 and weighted average of $72,402. Similarly, the statistical analysis conducted on geographies consisting of 415,854,714 people shows no correlation between the proportion of Immigrants from Korea and median household income in the United States with a correlation coefficient (R) of -0.046 and weighted average of $102,962, a difference of 42.2%.
Median Household Income Correlation Summary
| Measurement | Ute | Immigrants from Korea |
| Minimum | $30,694 | $26,550 |
| Maximum | $134,629 | $235,959 |
| Range | $103,935 | $209,409 |
| Mean | $62,668 | $116,491 |
| Median | $64,375 | $115,968 |
| Interquartile 25% (IQ1) | $40,417 | $93,452 |
| Interquartile 75% (IQ3) | $70,252 | $133,881 |
| Interquartile Range (IQR) | $29,835 | $40,429 |
| Standard Deviation (Sample) | $23,676 | $38,811 |
| Standard Deviation (Population) | $23,234 | $38,469 |
Similar Demographics by Median Household Income
Demographics Similar to Ute by Median Household Income
In terms of median household income, the demographic groups most similar to Ute are Potawatomi ($72,576, a difference of 0.24%), Yakama ($72,225, a difference of 0.25%), Honduran ($72,588, a difference of 0.26%), Immigrants from Haiti ($72,599, a difference of 0.27%), and African ($72,650, a difference of 0.34%).
| Demographics | Rating | Rank | Median Household Income |
| Immigrants | Dominica | 0.0 /100 | #300 | Tragic $72,760 |
| Cherokee | 0.0 /100 | #301 | Tragic $72,682 |
| Shoshone | 0.0 /100 | #302 | Tragic $72,660 |
| Africans | 0.0 /100 | #303 | Tragic $72,650 |
| Immigrants | Haiti | 0.0 /100 | #304 | Tragic $72,599 |
| Hondurans | 0.0 /100 | #305 | Tragic $72,588 |
| Potawatomi | 0.0 /100 | #306 | Tragic $72,576 |
| Ute | 0.0 /100 | #307 | Tragic $72,402 |
| Yakama | 0.0 /100 | #308 | Tragic $72,225 |
| Immigrants | Caribbean | 0.0 /100 | #309 | Tragic $71,860 |
| U.S. Virgin Islanders | 0.0 /100 | #310 | Tragic $71,853 |
| Immigrants | Zaire | 0.0 /100 | #311 | Tragic $71,801 |
| Immigrants | Honduras | 0.0 /100 | #312 | Tragic $71,452 |
| Immigrants | Bahamas | 0.0 /100 | #313 | Tragic $71,349 |
| Dominicans | 0.0 /100 | #314 | Tragic $71,302 |
Demographics Similar to Immigrants from Korea by Median Household Income
In terms of median household income, the demographic groups most similar to Immigrants from Korea are Cypriot ($102,843, a difference of 0.12%), Burmese ($103,145, a difference of 0.18%), Immigrants from Australia ($102,562, a difference of 0.39%), Bolivian ($102,195, a difference of 0.75%), and Immigrants from Israel ($104,090, a difference of 1.1%).
| Demographics | Rating | Rank | Median Household Income |
| Immigrants | South Central Asia | 100.0 /100 | #10 | Exceptional $106,057 |
| Immigrants | China | 100.0 /100 | #11 | Exceptional $105,335 |
| Indians (Asian) | 100.0 /100 | #12 | Exceptional $105,262 |
| Immigrants | Eastern Asia | 100.0 /100 | #13 | Exceptional $104,796 |
| Immigrants | Ireland | 100.0 /100 | #14 | Exceptional $104,692 |
| Immigrants | Israel | 100.0 /100 | #15 | Exceptional $104,090 |
| Burmese | 100.0 /100 | #16 | Exceptional $103,145 |
| Immigrants | Korea | 100.0 /100 | #17 | Exceptional $102,962 |
| Cypriots | 100.0 /100 | #18 | Exceptional $102,843 |
| Immigrants | Australia | 100.0 /100 | #19 | Exceptional $102,562 |
| Bolivians | 100.0 /100 | #20 | Exceptional $102,195 |
| Eastern Europeans | 100.0 /100 | #21 | Exceptional $101,781 |
| Asians | 100.0 /100 | #22 | Exceptional $101,681 |
| Immigrants | Bolivia | 100.0 /100 | #23 | Exceptional $101,394 |
| Immigrants | Japan | 100.0 /100 | #24 | Exceptional $100,711 |