Alsatian vs Immigrants from Iran Median Household Income
COMPARE
Alsatian
Immigrants from Iran
Median Household Income
Median Household Income Comparison
Alsatians
Immigrants from Iran
$85,053
MEDIAN HOUSEHOLD INCOME
49.2/ 100
METRIC RATING
176th/ 347
METRIC RANK
$108,055
MEDIAN HOUSEHOLD INCOME
100.0/ 100
METRIC RATING
8th/ 347
METRIC RANK
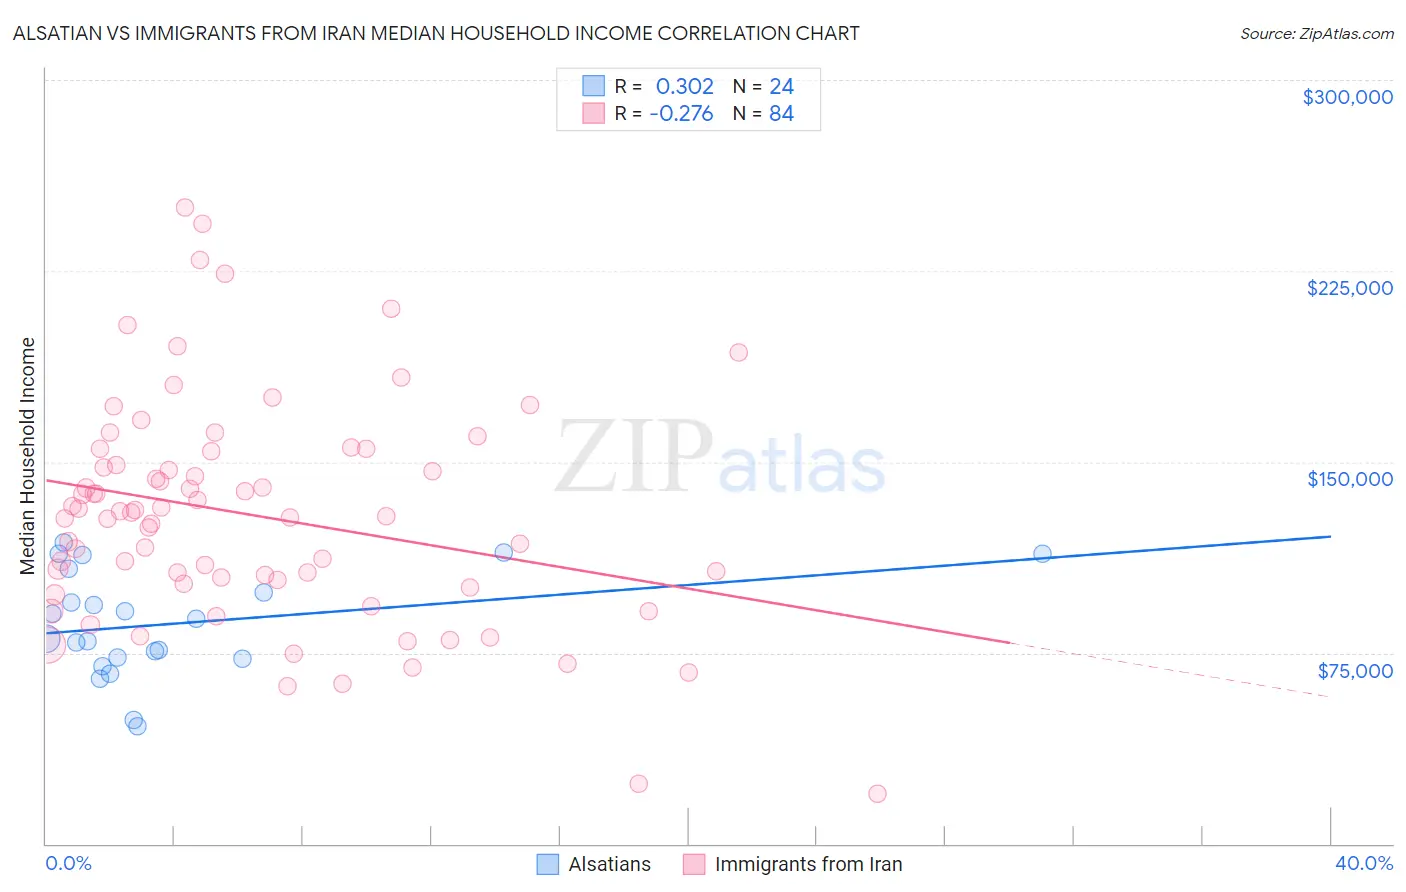
Alsatian vs Immigrants from Iran Median Household Income Correlation Chart
The statistical analysis conducted on geographies consisting of 82,678,631 people shows a mild positive correlation between the proportion of Alsatians and median household income in the United States with a correlation coefficient (R) of 0.302 and weighted average of $85,053. Similarly, the statistical analysis conducted on geographies consisting of 279,821,960 people shows a weak negative correlation between the proportion of Immigrants from Iran and median household income in the United States with a correlation coefficient (R) of -0.276 and weighted average of $108,055, a difference of 27.0%.
Median Household Income Correlation Summary
| Measurement | Alsatian | Immigrants from Iran |
| Minimum | $46,250 | $19,722 |
| Maximum | $118,135 | $250,001 |
| Range | $71,885 | $230,279 |
| Mean | $86,339 | $128,949 |
| Median | $84,486 | $129,200 |
| Interquartile 25% (IQ1) | $73,000 | $102,878 |
| Interquartile 75% (IQ3) | $103,435 | $151,481 |
| Interquartile Range (IQR) | $30,436 | $48,604 |
| Standard Deviation (Sample) | $20,538 | $44,216 |
| Standard Deviation (Population) | $20,105 | $43,952 |
Similar Demographics by Median Household Income
Demographics Similar to Alsatians by Median Household Income
In terms of median household income, the demographic groups most similar to Alsatians are Immigrants from Costa Rica ($85,054, a difference of 0.0%), Immigrants from Eritrea ($85,025, a difference of 0.030%), Scottish ($85,101, a difference of 0.060%), Czechoslovakian ($84,965, a difference of 0.10%), and English ($84,915, a difference of 0.16%).
| Demographics | Rating | Rank | Median Household Income |
| Colombians | 59.7 /100 | #169 | Average $85,716 |
| Swiss | 59.2 /100 | #170 | Average $85,681 |
| Immigrants | South America | 58.1 /100 | #171 | Average $85,611 |
| Slovenes | 57.4 /100 | #172 | Average $85,562 |
| Immigrants | Cameroon | 53.4 /100 | #173 | Average $85,314 |
| Scottish | 50.0 /100 | #174 | Average $85,101 |
| Immigrants | Costa Rica | 49.2 /100 | #175 | Average $85,054 |
| Alsatians | 49.2 /100 | #176 | Average $85,053 |
| Immigrants | Eritrea | 48.8 /100 | #177 | Average $85,025 |
| Czechoslovakians | 47.8 /100 | #178 | Average $84,965 |
| English | 47.0 /100 | #179 | Average $84,915 |
| Immigrants | Portugal | 44.2 /100 | #180 | Average $84,740 |
| Hawaiians | 44.1 /100 | #181 | Average $84,729 |
| Uruguayans | 43.5 /100 | #182 | Average $84,691 |
| Spaniards | 42.7 /100 | #183 | Average $84,644 |
Demographics Similar to Immigrants from Iran by Median Household Income
In terms of median household income, the demographic groups most similar to Immigrants from Iran are Okinawan ($106,624, a difference of 1.3%), Iranian ($109,835, a difference of 1.7%), Immigrants from South Central Asia ($106,057, a difference of 1.9%), Immigrants from Singapore ($110,428, a difference of 2.2%), and Thai ($110,648, a difference of 2.4%).
| Demographics | Rating | Rank | Median Household Income |
| Immigrants | Taiwan | 100.0 /100 | #1 | Exceptional $116,460 |
| Filipinos | 100.0 /100 | #2 | Exceptional $115,509 |
| Immigrants | India | 100.0 /100 | #3 | Exceptional $113,009 |
| Immigrants | Hong Kong | 100.0 /100 | #4 | Exceptional $111,519 |
| Thais | 100.0 /100 | #5 | Exceptional $110,648 |
| Immigrants | Singapore | 100.0 /100 | #6 | Exceptional $110,428 |
| Iranians | 100.0 /100 | #7 | Exceptional $109,835 |
| Immigrants | Iran | 100.0 /100 | #8 | Exceptional $108,055 |
| Okinawans | 100.0 /100 | #9 | Exceptional $106,624 |
| Immigrants | South Central Asia | 100.0 /100 | #10 | Exceptional $106,057 |
| Immigrants | China | 100.0 /100 | #11 | Exceptional $105,335 |
| Indians (Asian) | 100.0 /100 | #12 | Exceptional $105,262 |
| Immigrants | Eastern Asia | 100.0 /100 | #13 | Exceptional $104,796 |
| Immigrants | Ireland | 100.0 /100 | #14 | Exceptional $104,692 |
| Immigrants | Israel | 100.0 /100 | #15 | Exceptional $104,090 |