Ute vs Australian Median Family Income
COMPARE
Ute
Australian
Median Family Income
Median Family Income Comparison
Ute
Australians
$87,596
MEDIAN FAMILY INCOME
0.0/ 100
METRIC RATING
293rd/ 347
METRIC RANK
$118,440
MEDIAN FAMILY INCOME
100.0/ 100
METRIC RATING
37th/ 347
METRIC RANK
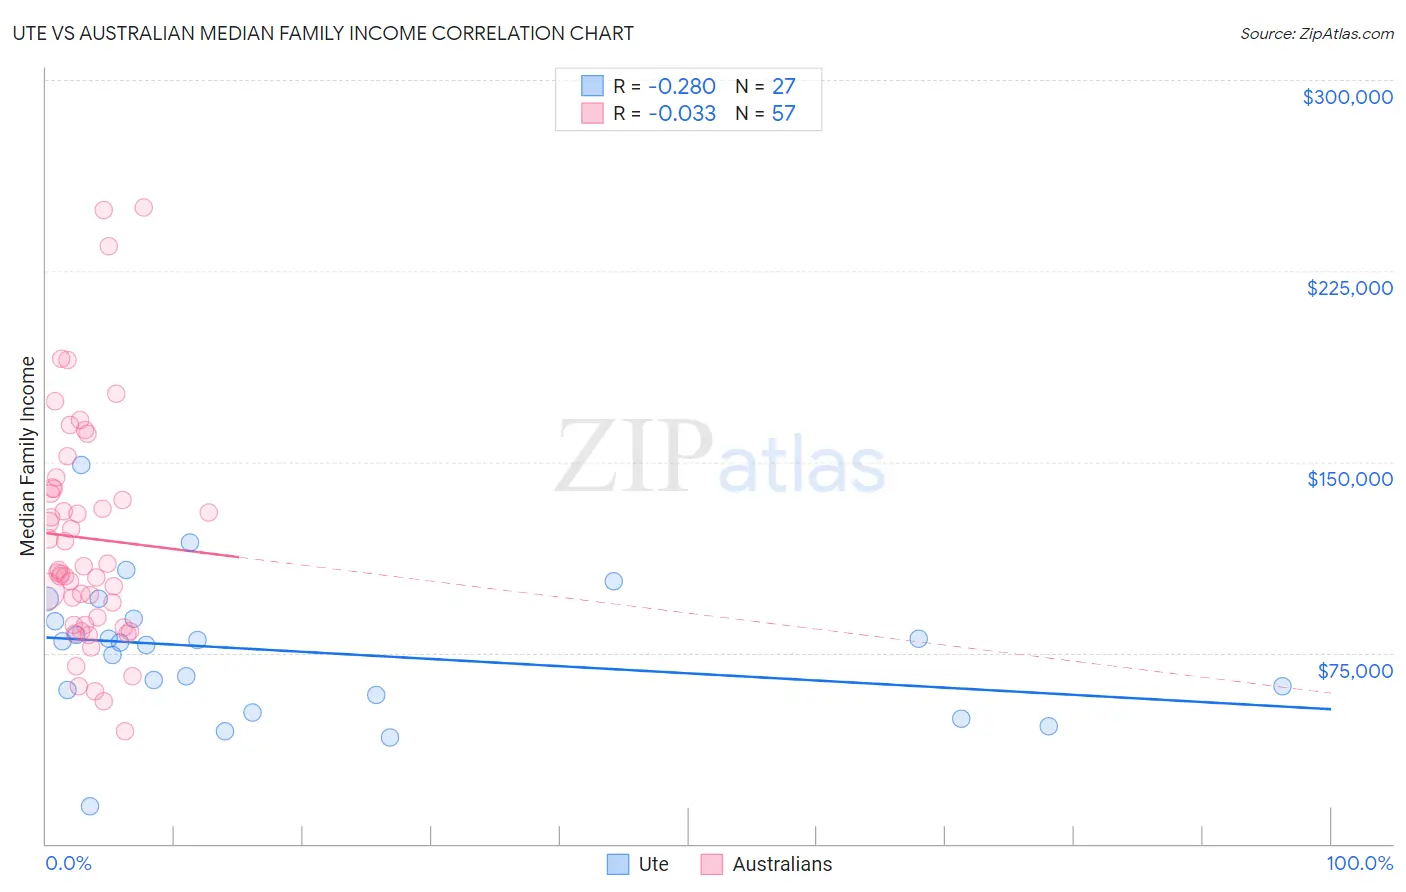
Ute vs Australian Median Family Income Correlation Chart
The statistical analysis conducted on geographies consisting of 55,656,168 people shows a weak negative correlation between the proportion of Ute and median family income in the United States with a correlation coefficient (R) of -0.280 and weighted average of $87,596. Similarly, the statistical analysis conducted on geographies consisting of 223,969,343 people shows no correlation between the proportion of Australians and median family income in the United States with a correlation coefficient (R) of -0.033 and weighted average of $118,440, a difference of 35.2%.
Median Family Income Correlation Summary
| Measurement | Ute | Australian |
| Minimum | $14,519 | $44,219 |
| Maximum | $148,724 | $250,001 |
| Range | $134,205 | $205,782 |
| Mean | $75,455 | $120,063 |
| Median | $78,980 | $107,342 |
| Interquartile 25% (IQ1) | $58,333 | $85,865 |
| Interquartile 75% (IQ3) | $88,500 | $139,651 |
| Interquartile Range (IQR) | $30,167 | $53,786 |
| Standard Deviation (Sample) | $27,197 | $45,096 |
| Standard Deviation (Population) | $26,688 | $44,699 |
Similar Demographics by Median Family Income
Demographics Similar to Ute by Median Family Income
In terms of median family income, the demographic groups most similar to Ute are Fijian ($87,387, a difference of 0.24%), African ($87,820, a difference of 0.26%), Immigrants from Cabo Verde ($87,830, a difference of 0.27%), Shoshone ($87,872, a difference of 0.32%), and Yaqui ($87,289, a difference of 0.35%).
| Demographics | Rating | Rank | Median Family Income |
| Immigrants | Nicaragua | 0.1 /100 | #286 | Tragic $88,267 |
| Potawatomi | 0.1 /100 | #287 | Tragic $88,265 |
| Cherokee | 0.1 /100 | #288 | Tragic $88,209 |
| Central American Indians | 0.1 /100 | #289 | Tragic $88,034 |
| Shoshone | 0.1 /100 | #290 | Tragic $87,872 |
| Immigrants | Cabo Verde | 0.1 /100 | #291 | Tragic $87,830 |
| Africans | 0.1 /100 | #292 | Tragic $87,820 |
| Ute | 0.0 /100 | #293 | Tragic $87,596 |
| Fijians | 0.0 /100 | #294 | Tragic $87,387 |
| Yaqui | 0.0 /100 | #295 | Tragic $87,289 |
| Immigrants | Guatemala | 0.0 /100 | #296 | Tragic $87,191 |
| Cajuns | 0.0 /100 | #297 | Tragic $87,157 |
| Immigrants | Latin America | 0.0 /100 | #298 | Tragic $86,989 |
| Chippewa | 0.0 /100 | #299 | Tragic $86,852 |
| Ottawa | 0.0 /100 | #300 | Tragic $86,380 |
Demographics Similar to Australians by Median Family Income
In terms of median family income, the demographic groups most similar to Australians are Immigrants from Turkey ($118,325, a difference of 0.10%), Israeli ($118,577, a difference of 0.12%), Immigrants from Asia ($118,291, a difference of 0.13%), Immigrants from Lithuania ($118,053, a difference of 0.33%), and Estonian ($118,013, a difference of 0.36%).
| Demographics | Rating | Rank | Median Family Income |
| Immigrants | Sri Lanka | 100.0 /100 | #30 | Exceptional $120,263 |
| Immigrants | France | 100.0 /100 | #31 | Exceptional $120,076 |
| Asians | 100.0 /100 | #32 | Exceptional $119,955 |
| Bhutanese | 100.0 /100 | #33 | Exceptional $119,800 |
| Bolivians | 100.0 /100 | #34 | Exceptional $119,479 |
| Soviet Union | 100.0 /100 | #35 | Exceptional $119,262 |
| Israelis | 100.0 /100 | #36 | Exceptional $118,577 |
| Australians | 100.0 /100 | #37 | Exceptional $118,440 |
| Immigrants | Turkey | 100.0 /100 | #38 | Exceptional $118,325 |
| Immigrants | Asia | 100.0 /100 | #39 | Exceptional $118,291 |
| Immigrants | Lithuania | 100.0 /100 | #40 | Exceptional $118,053 |
| Estonians | 100.0 /100 | #41 | Exceptional $118,013 |
| Immigrants | Bolivia | 100.0 /100 | #42 | Exceptional $117,912 |
| Bulgarians | 100.0 /100 | #43 | Exceptional $117,818 |
| Cambodians | 100.0 /100 | #44 | Exceptional $117,780 |