Immigrants from Asia vs Australian Median Family Income
COMPARE
Immigrants from Asia
Australian
Median Family Income
Median Family Income Comparison
Immigrants from Asia
Australians
$118,291
MEDIAN FAMILY INCOME
100.0/ 100
METRIC RATING
39th/ 347
METRIC RANK
$118,440
MEDIAN FAMILY INCOME
100.0/ 100
METRIC RATING
37th/ 347
METRIC RANK
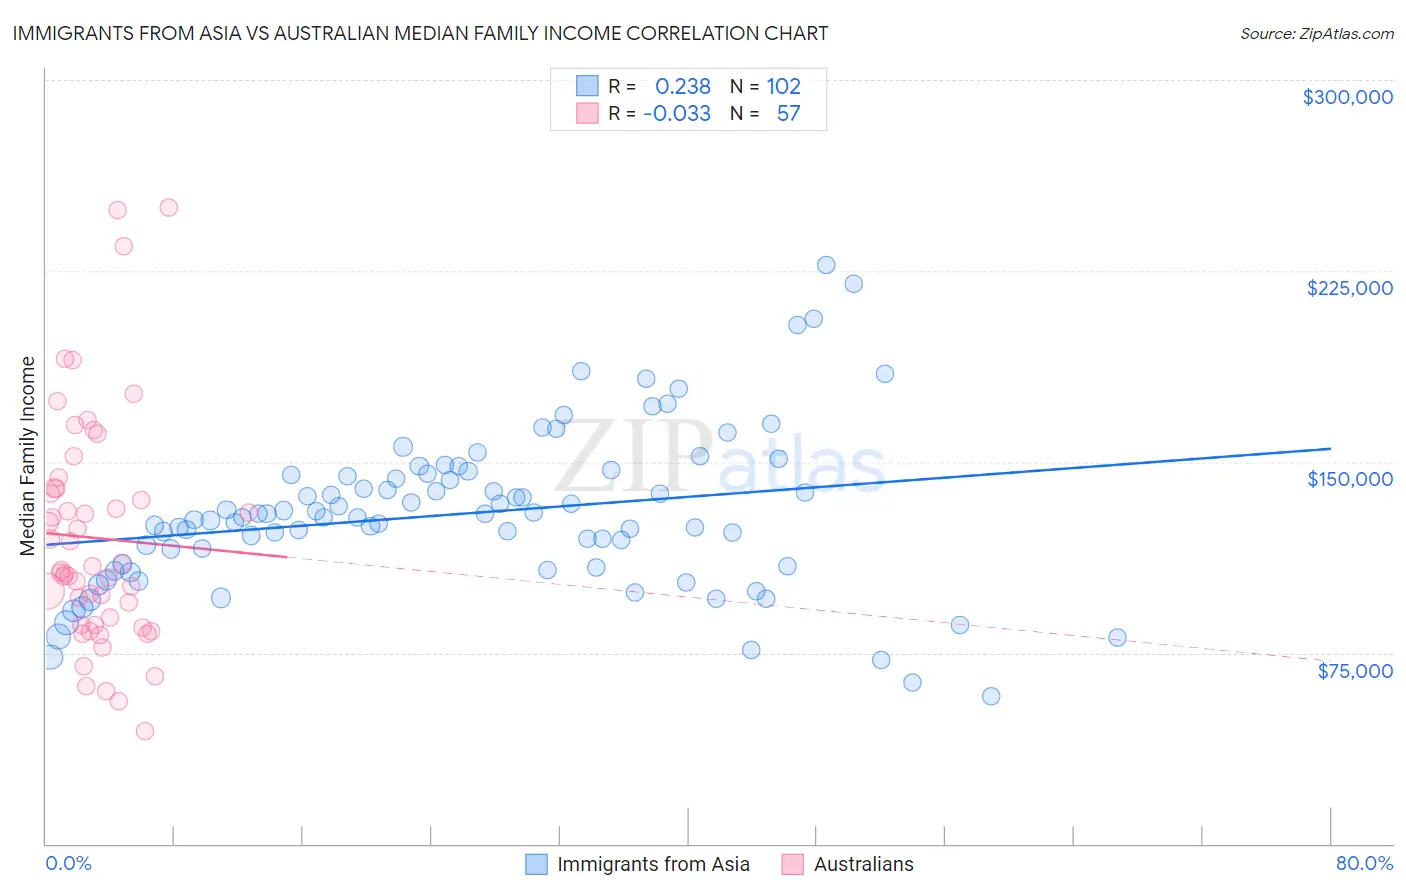
Immigrants from Asia vs Australian Median Family Income Correlation Chart
The statistical analysis conducted on geographies consisting of 548,079,334 people shows a weak positive correlation between the proportion of Immigrants from Asia and median family income in the United States with a correlation coefficient (R) of 0.238 and weighted average of $118,291. Similarly, the statistical analysis conducted on geographies consisting of 223,969,343 people shows no correlation between the proportion of Australians and median family income in the United States with a correlation coefficient (R) of -0.033 and weighted average of $118,440, a difference of 0.13%.
Median Family Income Correlation Summary
| Measurement | Immigrants from Asia | Australian |
| Minimum | $58,163 | $44,219 |
| Maximum | $227,279 | $250,001 |
| Range | $169,116 | $205,782 |
| Mean | $129,737 | $120,063 |
| Median | $128,095 | $107,342 |
| Interquartile 25% (IQ1) | $109,196 | $85,865 |
| Interquartile 75% (IQ3) | $144,788 | $139,651 |
| Interquartile Range (IQR) | $35,592 | $53,786 |
| Standard Deviation (Sample) | $31,368 | $45,096 |
| Standard Deviation (Population) | $31,213 | $44,699 |
Demographics Similar to Immigrants from Asia and Australians by Median Family Income
In terms of median family income, the demographic groups most similar to Immigrants from Asia are Immigrants from Turkey ($118,325, a difference of 0.030%), Immigrants from Lithuania ($118,053, a difference of 0.20%), Israeli ($118,577, a difference of 0.24%), Estonian ($118,013, a difference of 0.24%), and Immigrants from Bolivia ($117,912, a difference of 0.32%). Similarly, the demographic groups most similar to Australians are Immigrants from Turkey ($118,325, a difference of 0.10%), Israeli ($118,577, a difference of 0.12%), Immigrants from Lithuania ($118,053, a difference of 0.33%), Estonian ($118,013, a difference of 0.36%), and Immigrants from Bolivia ($117,912, a difference of 0.45%).
| Demographics | Rating | Rank | Median Family Income |
| Immigrants | Denmark | 100.0 /100 | #28 | Exceptional $120,445 |
| Latvians | 100.0 /100 | #29 | Exceptional $120,301 |
| Immigrants | Sri Lanka | 100.0 /100 | #30 | Exceptional $120,263 |
| Immigrants | France | 100.0 /100 | #31 | Exceptional $120,076 |
| Asians | 100.0 /100 | #32 | Exceptional $119,955 |
| Bhutanese | 100.0 /100 | #33 | Exceptional $119,800 |
| Bolivians | 100.0 /100 | #34 | Exceptional $119,479 |
| Soviet Union | 100.0 /100 | #35 | Exceptional $119,262 |
| Israelis | 100.0 /100 | #36 | Exceptional $118,577 |
| Australians | 100.0 /100 | #37 | Exceptional $118,440 |
| Immigrants | Turkey | 100.0 /100 | #38 | Exceptional $118,325 |
| Immigrants | Asia | 100.0 /100 | #39 | Exceptional $118,291 |
| Immigrants | Lithuania | 100.0 /100 | #40 | Exceptional $118,053 |
| Estonians | 100.0 /100 | #41 | Exceptional $118,013 |
| Immigrants | Bolivia | 100.0 /100 | #42 | Exceptional $117,912 |
| Bulgarians | 100.0 /100 | #43 | Exceptional $117,818 |
| Cambodians | 100.0 /100 | #44 | Exceptional $117,780 |
| Immigrants | Greece | 99.9 /100 | #45 | Exceptional $117,344 |
| Immigrants | Russia | 99.9 /100 | #46 | Exceptional $116,942 |
| Immigrants | Austria | 99.9 /100 | #47 | Exceptional $116,830 |
| Immigrants | South Africa | 99.9 /100 | #48 | Exceptional $116,286 |