Immigrants from Denmark vs Australian Median Family Income
COMPARE
Immigrants from Denmark
Australian
Median Family Income
Median Family Income Comparison
Immigrants from Denmark
Australians
$120,445
MEDIAN FAMILY INCOME
100.0/ 100
METRIC RATING
28th/ 347
METRIC RANK
$118,440
MEDIAN FAMILY INCOME
100.0/ 100
METRIC RATING
37th/ 347
METRIC RANK
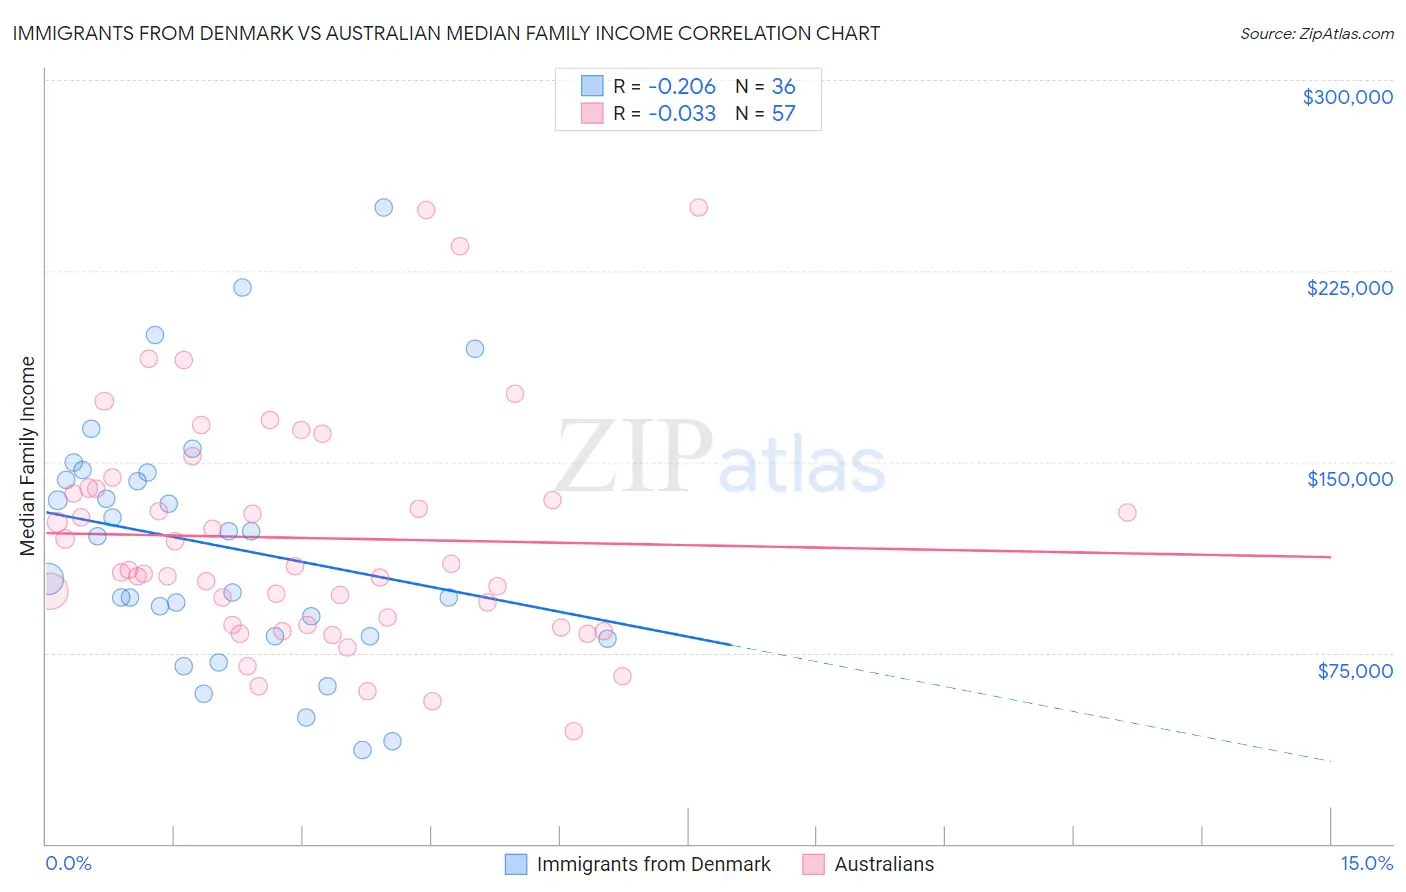
Immigrants from Denmark vs Australian Median Family Income Correlation Chart
The statistical analysis conducted on geographies consisting of 136,397,640 people shows a weak negative correlation between the proportion of Immigrants from Denmark and median family income in the United States with a correlation coefficient (R) of -0.206 and weighted average of $120,445. Similarly, the statistical analysis conducted on geographies consisting of 223,969,343 people shows no correlation between the proportion of Australians and median family income in the United States with a correlation coefficient (R) of -0.033 and weighted average of $118,440, a difference of 1.7%.
Median Family Income Correlation Summary
| Measurement | Immigrants from Denmark | Australian |
| Minimum | $36,611 | $44,219 |
| Maximum | $250,001 | $250,001 |
| Range | $213,390 | $205,782 |
| Mean | $116,902 | $120,063 |
| Median | $112,401 | $107,342 |
| Interquartile 25% (IQ1) | $81,504 | $85,865 |
| Interquartile 75% (IQ3) | $144,309 | $139,651 |
| Interquartile Range (IQR) | $62,805 | $53,786 |
| Standard Deviation (Sample) | $49,223 | $45,096 |
| Standard Deviation (Population) | $48,535 | $44,699 |
Demographics Similar to Immigrants from Denmark and Australians by Median Family Income
In terms of median family income, the demographic groups most similar to Immigrants from Denmark are Russian ($120,487, a difference of 0.040%), Latvian ($120,301, a difference of 0.12%), Immigrants from Sri Lanka ($120,263, a difference of 0.15%), Immigrants from Switzerland ($120,726, a difference of 0.23%), and Immigrants from France ($120,076, a difference of 0.31%). Similarly, the demographic groups most similar to Australians are Immigrants from Turkey ($118,325, a difference of 0.10%), Israeli ($118,577, a difference of 0.12%), Immigrants from Asia ($118,291, a difference of 0.13%), Immigrants from Lithuania ($118,053, a difference of 0.33%), and Estonian ($118,013, a difference of 0.36%).
| Demographics | Rating | Rank | Median Family Income |
| Immigrants | Sweden | 100.0 /100 | #22 | Exceptional $122,765 |
| Immigrants | Japan | 100.0 /100 | #23 | Exceptional $122,764 |
| Immigrants | Northern Europe | 100.0 /100 | #24 | Exceptional $121,840 |
| Turks | 100.0 /100 | #25 | Exceptional $121,202 |
| Immigrants | Switzerland | 100.0 /100 | #26 | Exceptional $120,726 |
| Russians | 100.0 /100 | #27 | Exceptional $120,487 |
| Immigrants | Denmark | 100.0 /100 | #28 | Exceptional $120,445 |
| Latvians | 100.0 /100 | #29 | Exceptional $120,301 |
| Immigrants | Sri Lanka | 100.0 /100 | #30 | Exceptional $120,263 |
| Immigrants | France | 100.0 /100 | #31 | Exceptional $120,076 |
| Asians | 100.0 /100 | #32 | Exceptional $119,955 |
| Bhutanese | 100.0 /100 | #33 | Exceptional $119,800 |
| Bolivians | 100.0 /100 | #34 | Exceptional $119,479 |
| Soviet Union | 100.0 /100 | #35 | Exceptional $119,262 |
| Israelis | 100.0 /100 | #36 | Exceptional $118,577 |
| Australians | 100.0 /100 | #37 | Exceptional $118,440 |
| Immigrants | Turkey | 100.0 /100 | #38 | Exceptional $118,325 |
| Immigrants | Asia | 100.0 /100 | #39 | Exceptional $118,291 |
| Immigrants | Lithuania | 100.0 /100 | #40 | Exceptional $118,053 |
| Estonians | 100.0 /100 | #41 | Exceptional $118,013 |
| Immigrants | Bolivia | 100.0 /100 | #42 | Exceptional $117,912 |