Ute vs Immigrants from Egypt Median Family Income
COMPARE
Ute
Immigrants from Egypt
Median Family Income
Median Family Income Comparison
Ute
Immigrants from Egypt
$87,596
MEDIAN FAMILY INCOME
0.0/ 100
METRIC RATING
293rd/ 347
METRIC RANK
$111,689
MEDIAN FAMILY INCOME
99.0/ 100
METRIC RATING
83rd/ 347
METRIC RANK
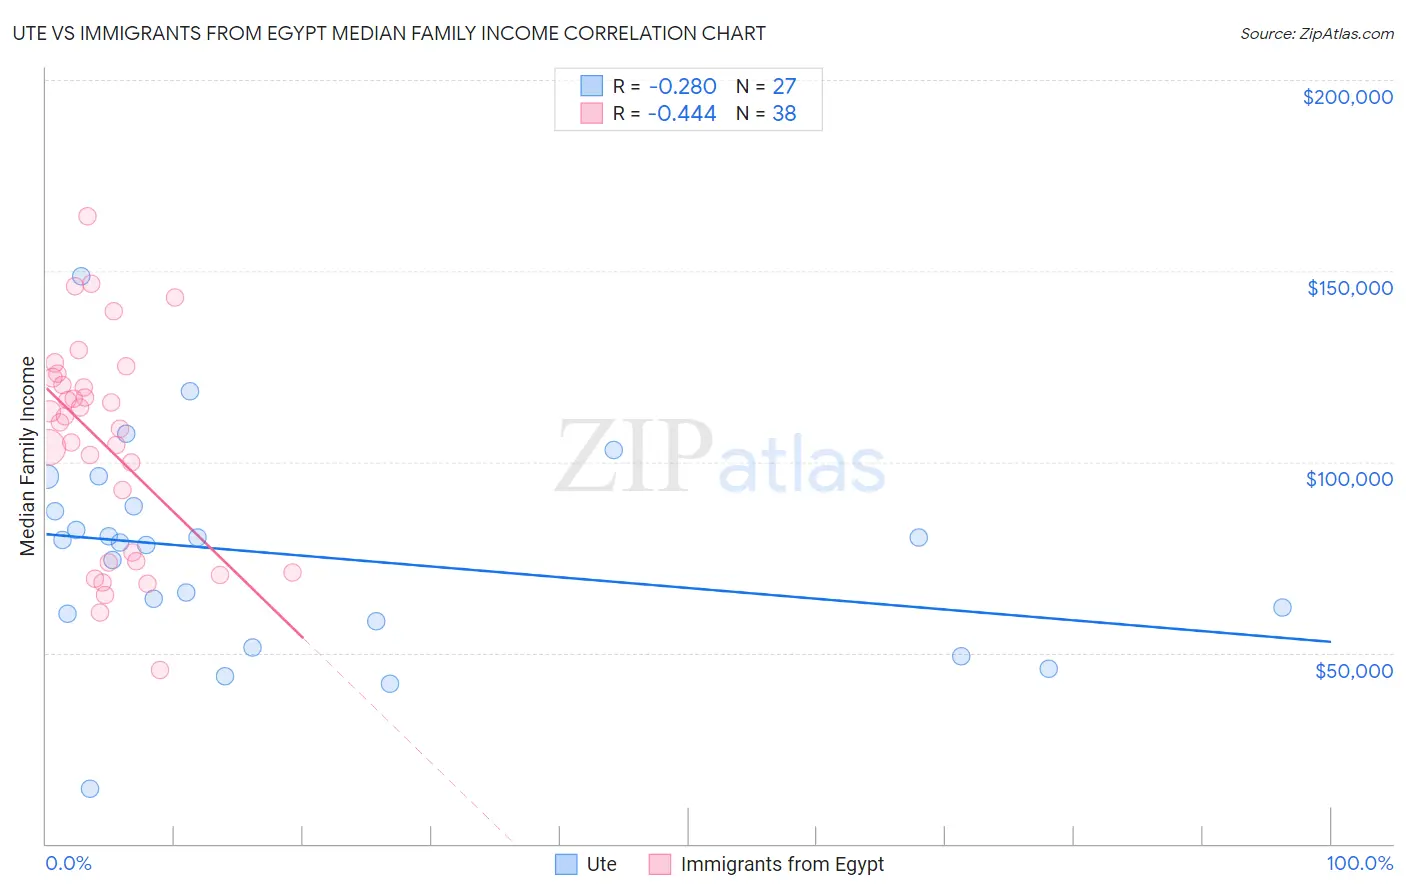
Ute vs Immigrants from Egypt Median Family Income Correlation Chart
The statistical analysis conducted on geographies consisting of 55,656,168 people shows a weak negative correlation between the proportion of Ute and median family income in the United States with a correlation coefficient (R) of -0.280 and weighted average of $87,596. Similarly, the statistical analysis conducted on geographies consisting of 245,384,191 people shows a moderate negative correlation between the proportion of Immigrants from Egypt and median family income in the United States with a correlation coefficient (R) of -0.444 and weighted average of $111,689, a difference of 27.5%.
Median Family Income Correlation Summary
| Measurement | Ute | Immigrants from Egypt |
| Minimum | $14,519 | $45,581 |
| Maximum | $148,724 | $164,298 |
| Range | $134,205 | $118,717 |
| Mean | $75,455 | $104,674 |
| Median | $78,980 | $111,132 |
| Interquartile 25% (IQ1) | $58,333 | $74,063 |
| Interquartile 75% (IQ3) | $88,500 | $122,004 |
| Interquartile Range (IQR) | $30,167 | $47,941 |
| Standard Deviation (Sample) | $27,197 | $28,077 |
| Standard Deviation (Population) | $26,688 | $27,705 |
Similar Demographics by Median Family Income
Demographics Similar to Ute by Median Family Income
In terms of median family income, the demographic groups most similar to Ute are Fijian ($87,387, a difference of 0.24%), African ($87,820, a difference of 0.26%), Immigrants from Cabo Verde ($87,830, a difference of 0.27%), Shoshone ($87,872, a difference of 0.32%), and Yaqui ($87,289, a difference of 0.35%).
| Demographics | Rating | Rank | Median Family Income |
| Immigrants | Nicaragua | 0.1 /100 | #286 | Tragic $88,267 |
| Potawatomi | 0.1 /100 | #287 | Tragic $88,265 |
| Cherokee | 0.1 /100 | #288 | Tragic $88,209 |
| Central American Indians | 0.1 /100 | #289 | Tragic $88,034 |
| Shoshone | 0.1 /100 | #290 | Tragic $87,872 |
| Immigrants | Cabo Verde | 0.1 /100 | #291 | Tragic $87,830 |
| Africans | 0.1 /100 | #292 | Tragic $87,820 |
| Ute | 0.0 /100 | #293 | Tragic $87,596 |
| Fijians | 0.0 /100 | #294 | Tragic $87,387 |
| Yaqui | 0.0 /100 | #295 | Tragic $87,289 |
| Immigrants | Guatemala | 0.0 /100 | #296 | Tragic $87,191 |
| Cajuns | 0.0 /100 | #297 | Tragic $87,157 |
| Immigrants | Latin America | 0.0 /100 | #298 | Tragic $86,989 |
| Chippewa | 0.0 /100 | #299 | Tragic $86,852 |
| Ottawa | 0.0 /100 | #300 | Tragic $86,380 |
Demographics Similar to Immigrants from Egypt by Median Family Income
In terms of median family income, the demographic groups most similar to Immigrants from Egypt are Immigrants from Hungary ($111,378, a difference of 0.28%), Croatian ($111,370, a difference of 0.29%), Ukrainian ($111,368, a difference of 0.29%), Immigrants from England ($112,038, a difference of 0.31%), and Austrian ($111,306, a difference of 0.34%).
| Demographics | Rating | Rank | Median Family Income |
| Argentineans | 99.4 /100 | #76 | Exceptional $112,665 |
| Immigrants | Eastern Europe | 99.4 /100 | #77 | Exceptional $112,527 |
| Immigrants | Canada | 99.3 /100 | #78 | Exceptional $112,374 |
| Italians | 99.3 /100 | #79 | Exceptional $112,372 |
| Immigrants | Croatia | 99.3 /100 | #80 | Exceptional $112,323 |
| Immigrants | North America | 99.2 /100 | #81 | Exceptional $112,151 |
| Immigrants | England | 99.2 /100 | #82 | Exceptional $112,038 |
| Immigrants | Egypt | 99.0 /100 | #83 | Exceptional $111,689 |
| Immigrants | Hungary | 98.8 /100 | #84 | Exceptional $111,378 |
| Croatians | 98.8 /100 | #85 | Exceptional $111,370 |
| Ukrainians | 98.8 /100 | #86 | Exceptional $111,368 |
| Austrians | 98.8 /100 | #87 | Exceptional $111,306 |
| Romanians | 98.8 /100 | #88 | Exceptional $111,243 |
| Immigrants | Argentina | 98.5 /100 | #89 | Exceptional $110,873 |
| Northern Europeans | 98.3 /100 | #90 | Exceptional $110,635 |