Syrian vs Immigrants from Asia Median Household Income
COMPARE
Syrian
Immigrants from Asia
Median Household Income
Median Household Income Comparison
Syrians
Immigrants from Asia
$89,830
MEDIAN HOUSEHOLD INCOME
95.4/ 100
METRIC RATING
118th/ 347
METRIC RANK
$99,933
MEDIAN HOUSEHOLD INCOME
100.0/ 100
METRIC RATING
29th/ 347
METRIC RANK
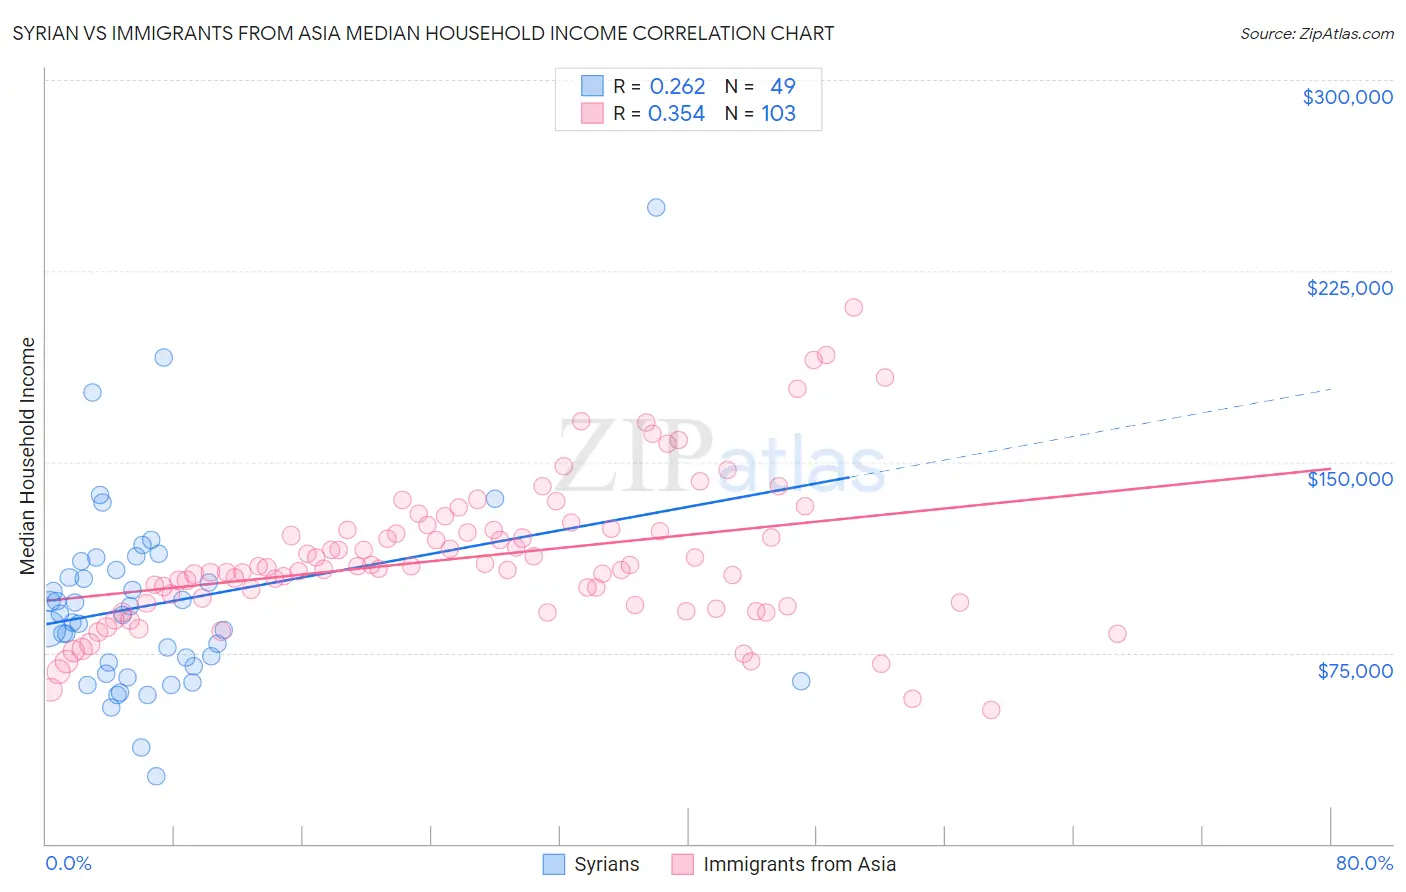
Syrian vs Immigrants from Asia Median Household Income Correlation Chart
The statistical analysis conducted on geographies consisting of 266,119,923 people shows a weak positive correlation between the proportion of Syrians and median household income in the United States with a correlation coefficient (R) of 0.262 and weighted average of $89,830. Similarly, the statistical analysis conducted on geographies consisting of 548,273,530 people shows a mild positive correlation between the proportion of Immigrants from Asia and median household income in the United States with a correlation coefficient (R) of 0.354 and weighted average of $99,933, a difference of 11.3%.
Median Household Income Correlation Summary
| Measurement | Syrian | Immigrants from Asia |
| Minimum | $26,364 | $52,658 |
| Maximum | $250,001 | $210,660 |
| Range | $223,637 | $158,002 |
| Mean | $94,106 | $112,443 |
| Median | $89,903 | $108,674 |
| Interquartile 25% (IQ1) | $68,162 | $93,690 |
| Interquartile 75% (IQ3) | $109,343 | $123,452 |
| Interquartile Range (IQR) | $41,181 | $29,762 |
| Standard Deviation (Sample) | $38,336 | $28,979 |
| Standard Deviation (Population) | $37,943 | $28,838 |
Similar Demographics by Median Household Income
Demographics Similar to Syrians by Median Household Income
In terms of median household income, the demographic groups most similar to Syrians are Taiwanese ($89,900, a difference of 0.080%), Native Hawaiian ($89,919, a difference of 0.10%), Albanian ($89,744, a difference of 0.10%), Immigrants from North Macedonia ($89,741, a difference of 0.10%), and Immigrants from Western Asia ($90,005, a difference of 0.19%).
| Demographics | Rating | Rank | Median Household Income |
| Immigrants | Poland | 97.1 /100 | #111 | Exceptional $90,549 |
| Northern Europeans | 96.9 /100 | #112 | Exceptional $90,446 |
| Peruvians | 96.5 /100 | #113 | Exceptional $90,261 |
| Immigrants | Northern Africa | 95.9 /100 | #114 | Exceptional $90,026 |
| Immigrants | Western Asia | 95.9 /100 | #115 | Exceptional $90,005 |
| Native Hawaiians | 95.7 /100 | #116 | Exceptional $89,919 |
| Taiwanese | 95.6 /100 | #117 | Exceptional $89,900 |
| Syrians | 95.4 /100 | #118 | Exceptional $89,830 |
| Albanians | 95.2 /100 | #119 | Exceptional $89,744 |
| Immigrants | North Macedonia | 95.2 /100 | #120 | Exceptional $89,741 |
| Ethiopians | 94.9 /100 | #121 | Exceptional $89,640 |
| Pakistanis | 94.8 /100 | #122 | Exceptional $89,638 |
| Immigrants | Zimbabwe | 94.4 /100 | #123 | Exceptional $89,496 |
| Immigrants | Jordan | 94.1 /100 | #124 | Exceptional $89,412 |
| Immigrants | Kuwait | 93.5 /100 | #125 | Exceptional $89,263 |
Demographics Similar to Immigrants from Asia by Median Household Income
In terms of median household income, the demographic groups most similar to Immigrants from Asia are Immigrants from Sri Lanka ($99,943, a difference of 0.010%), Immigrants from Northern Europe ($99,813, a difference of 0.12%), Bhutanese ($100,151, a difference of 0.22%), Immigrants from Belgium ($100,306, a difference of 0.37%), and Turkish ($99,389, a difference of 0.55%).
| Demographics | Rating | Rank | Median Household Income |
| Asians | 100.0 /100 | #22 | Exceptional $101,681 |
| Immigrants | Bolivia | 100.0 /100 | #23 | Exceptional $101,394 |
| Immigrants | Japan | 100.0 /100 | #24 | Exceptional $100,711 |
| Immigrants | Sweden | 100.0 /100 | #25 | Exceptional $100,699 |
| Immigrants | Belgium | 100.0 /100 | #26 | Exceptional $100,306 |
| Bhutanese | 100.0 /100 | #27 | Exceptional $100,151 |
| Immigrants | Sri Lanka | 100.0 /100 | #28 | Exceptional $99,943 |
| Immigrants | Asia | 100.0 /100 | #29 | Exceptional $99,933 |
| Immigrants | Northern Europe | 100.0 /100 | #30 | Exceptional $99,813 |
| Turks | 100.0 /100 | #31 | Exceptional $99,389 |
| Immigrants | Denmark | 100.0 /100 | #32 | Exceptional $98,510 |
| Chinese | 100.0 /100 | #33 | Exceptional $98,496 |
| Russians | 100.0 /100 | #34 | Exceptional $98,008 |
| Immigrants | Switzerland | 100.0 /100 | #35 | Exceptional $97,979 |
| Immigrants | Pakistan | 100.0 /100 | #36 | Exceptional $97,528 |