Syrian vs Egyptian Householder Income Under 25 years
COMPARE
Syrian
Egyptian
Householder Income Under 25 years
Householder Income Under 25 years Comparison
Syrians
Egyptians
$51,353
HOUSEHOLDER INCOME UNDER 25 YEARS
11.4/ 100
METRIC RATING
209th/ 347
METRIC RANK
$54,444
HOUSEHOLDER INCOME UNDER 25 YEARS
99.6/ 100
METRIC RATING
80th/ 347
METRIC RANK
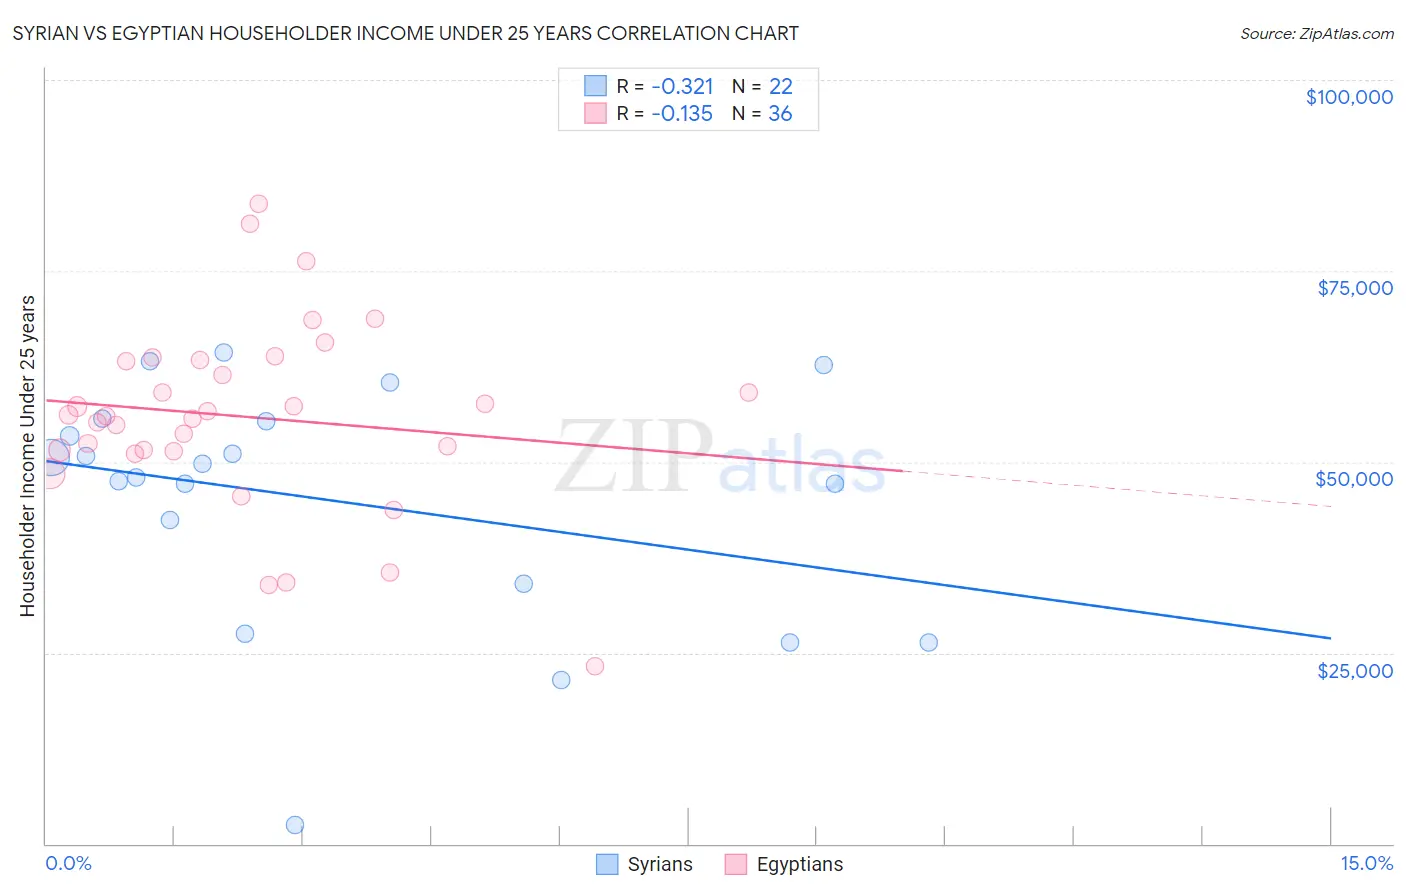
Syrian vs Egyptian Householder Income Under 25 years Correlation Chart
The statistical analysis conducted on geographies consisting of 232,232,125 people shows a mild negative correlation between the proportion of Syrians and household income with householder under the age of 25 in the United States with a correlation coefficient (R) of -0.321 and weighted average of $51,353. Similarly, the statistical analysis conducted on geographies consisting of 240,038,174 people shows a poor negative correlation between the proportion of Egyptians and household income with householder under the age of 25 in the United States with a correlation coefficient (R) of -0.135 and weighted average of $54,444, a difference of 6.0%.
Householder Income Under 25 years Correlation Summary
| Measurement | Syrian | Egyptian |
| Minimum | $2,499 | $23,214 |
| Maximum | $64,366 | $83,750 |
| Range | $61,867 | $60,536 |
| Mean | $44,870 | $55,910 |
| Median | $48,867 | $56,055 |
| Interquartile 25% (IQ1) | $33,995 | $51,447 |
| Interquartile 75% (IQ3) | $55,261 | $63,229 |
| Interquartile Range (IQR) | $21,267 | $11,783 |
| Standard Deviation (Sample) | $15,709 | $12,425 |
| Standard Deviation (Population) | $15,348 | $12,251 |
Similar Demographics by Householder Income Under 25 years
Demographics Similar to Syrians by Householder Income Under 25 years
In terms of householder income under 25 years, the demographic groups most similar to Syrians are Immigrants from Jordan ($51,370, a difference of 0.030%), Immigrants from Ghana ($51,333, a difference of 0.040%), South African ($51,383, a difference of 0.060%), Cape Verdean ($51,387, a difference of 0.070%), and Immigrants from Latin America ($51,387, a difference of 0.070%).
| Demographics | Rating | Rank | Householder Income Under 25 years |
| Immigrants | Guatemala | 14.0 /100 | #202 | Poor $51,447 |
| Immigrants | Cameroon | 13.6 /100 | #203 | Poor $51,433 |
| Czechs | 13.2 /100 | #204 | Poor $51,421 |
| Cape Verdeans | 12.3 /100 | #205 | Poor $51,387 |
| Immigrants | Latin America | 12.3 /100 | #206 | Poor $51,387 |
| South Africans | 12.2 /100 | #207 | Poor $51,383 |
| Immigrants | Jordan | 11.9 /100 | #208 | Poor $51,370 |
| Syrians | 11.4 /100 | #209 | Poor $51,353 |
| Immigrants | Ghana | 10.9 /100 | #210 | Poor $51,333 |
| Irish | 10.6 /100 | #211 | Poor $51,317 |
| Immigrants | Panama | 9.7 /100 | #212 | Tragic $51,278 |
| Dutch | 9.4 /100 | #213 | Tragic $51,265 |
| Zimbabweans | 9.3 /100 | #214 | Tragic $51,259 |
| Icelanders | 9.1 /100 | #215 | Tragic $51,247 |
| French | 8.7 /100 | #216 | Tragic $51,230 |
Demographics Similar to Egyptians by Householder Income Under 25 years
In terms of householder income under 25 years, the demographic groups most similar to Egyptians are Immigrants from Italy ($54,449, a difference of 0.010%), Portuguese ($54,436, a difference of 0.010%), Nepalese ($54,472, a difference of 0.050%), Immigrants from Southern Europe ($54,484, a difference of 0.070%), and Immigrants from Brazil ($54,487, a difference of 0.080%).
| Demographics | Rating | Rank | Householder Income Under 25 years |
| Macedonians | 99.7 /100 | #73 | Exceptional $54,563 |
| Immigrants | Grenada | 99.7 /100 | #74 | Exceptional $54,538 |
| Immigrants | Sri Lanka | 99.7 /100 | #75 | Exceptional $54,512 |
| Immigrants | Brazil | 99.6 /100 | #76 | Exceptional $54,487 |
| Immigrants | Southern Europe | 99.6 /100 | #77 | Exceptional $54,484 |
| Nepalese | 99.6 /100 | #78 | Exceptional $54,472 |
| Immigrants | Italy | 99.6 /100 | #79 | Exceptional $54,449 |
| Egyptians | 99.6 /100 | #80 | Exceptional $54,444 |
| Portuguese | 99.6 /100 | #81 | Exceptional $54,436 |
| Russians | 99.5 /100 | #82 | Exceptional $54,389 |
| Laotians | 99.5 /100 | #83 | Exceptional $54,369 |
| Bulgarians | 99.5 /100 | #84 | Exceptional $54,352 |
| Immigrants | Czechoslovakia | 99.5 /100 | #85 | Exceptional $54,352 |
| Immigrants | Croatia | 99.5 /100 | #86 | Exceptional $54,343 |
| Brazilians | 99.5 /100 | #87 | Exceptional $54,335 |