Syrian vs Kiowa Householder Income Under 25 years
COMPARE
Syrian
Kiowa
Householder Income Under 25 years
Householder Income Under 25 years Comparison
Syrians
Kiowa
$51,353
HOUSEHOLDER INCOME UNDER 25 YEARS
11.4/ 100
METRIC RATING
209th/ 347
METRIC RANK
$44,733
HOUSEHOLDER INCOME UNDER 25 YEARS
0.0/ 100
METRIC RATING
339th/ 347
METRIC RANK
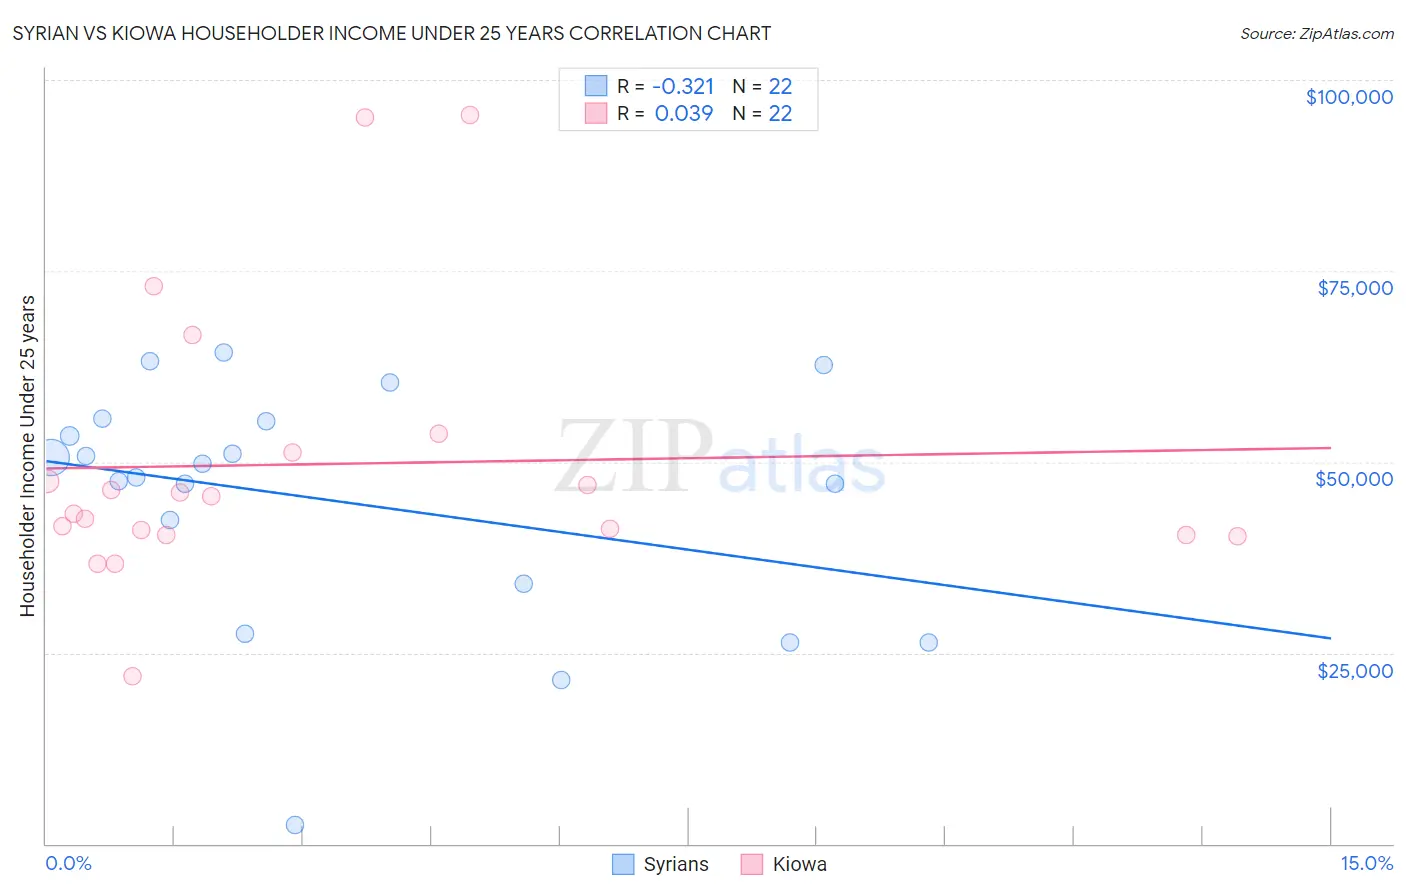
Syrian vs Kiowa Householder Income Under 25 years Correlation Chart
The statistical analysis conducted on geographies consisting of 232,232,125 people shows a mild negative correlation between the proportion of Syrians and household income with householder under the age of 25 in the United States with a correlation coefficient (R) of -0.321 and weighted average of $51,353. Similarly, the statistical analysis conducted on geographies consisting of 54,795,251 people shows no correlation between the proportion of Kiowa and household income with householder under the age of 25 in the United States with a correlation coefficient (R) of 0.039 and weighted average of $44,733, a difference of 14.8%.
Householder Income Under 25 years Correlation Summary
| Measurement | Syrian | Kiowa |
| Minimum | $2,499 | $21,932 |
| Maximum | $64,366 | $95,455 |
| Range | $61,867 | $73,523 |
| Mean | $44,870 | $49,706 |
| Median | $48,867 | $44,320 |
| Interquartile 25% (IQ1) | $33,995 | $40,500 |
| Interquartile 75% (IQ3) | $55,261 | $51,250 |
| Interquartile Range (IQR) | $21,267 | $10,750 |
| Standard Deviation (Sample) | $15,709 | $17,903 |
| Standard Deviation (Population) | $15,348 | $17,492 |
Similar Demographics by Householder Income Under 25 years
Demographics Similar to Syrians by Householder Income Under 25 years
In terms of householder income under 25 years, the demographic groups most similar to Syrians are Immigrants from Jordan ($51,370, a difference of 0.030%), Immigrants from Ghana ($51,333, a difference of 0.040%), South African ($51,383, a difference of 0.060%), Cape Verdean ($51,387, a difference of 0.070%), and Immigrants from Latin America ($51,387, a difference of 0.070%).
| Demographics | Rating | Rank | Householder Income Under 25 years |
| Immigrants | Guatemala | 14.0 /100 | #202 | Poor $51,447 |
| Immigrants | Cameroon | 13.6 /100 | #203 | Poor $51,433 |
| Czechs | 13.2 /100 | #204 | Poor $51,421 |
| Cape Verdeans | 12.3 /100 | #205 | Poor $51,387 |
| Immigrants | Latin America | 12.3 /100 | #206 | Poor $51,387 |
| South Africans | 12.2 /100 | #207 | Poor $51,383 |
| Immigrants | Jordan | 11.9 /100 | #208 | Poor $51,370 |
| Syrians | 11.4 /100 | #209 | Poor $51,353 |
| Immigrants | Ghana | 10.9 /100 | #210 | Poor $51,333 |
| Irish | 10.6 /100 | #211 | Poor $51,317 |
| Immigrants | Panama | 9.7 /100 | #212 | Tragic $51,278 |
| Dutch | 9.4 /100 | #213 | Tragic $51,265 |
| Zimbabweans | 9.3 /100 | #214 | Tragic $51,259 |
| Icelanders | 9.1 /100 | #215 | Tragic $51,247 |
| French | 8.7 /100 | #216 | Tragic $51,230 |
Demographics Similar to Kiowa by Householder Income Under 25 years
In terms of householder income under 25 years, the demographic groups most similar to Kiowa are Chickasaw ($44,763, a difference of 0.070%), Pueblo ($45,018, a difference of 0.64%), Black/African American ($44,381, a difference of 0.79%), Houma ($44,356, a difference of 0.85%), and Tohono O'odham ($45,248, a difference of 1.1%).
| Demographics | Rating | Rank | Householder Income Under 25 years |
| Choctaw | 0.0 /100 | #332 | Tragic $45,450 |
| Creek | 0.0 /100 | #333 | Tragic $45,371 |
| Cajuns | 0.0 /100 | #334 | Tragic $45,338 |
| Cheyenne | 0.0 /100 | #335 | Tragic $45,275 |
| Tohono O'odham | 0.0 /100 | #336 | Tragic $45,248 |
| Pueblo | 0.0 /100 | #337 | Tragic $45,018 |
| Chickasaw | 0.0 /100 | #338 | Tragic $44,763 |
| Kiowa | 0.0 /100 | #339 | Tragic $44,733 |
| Blacks/African Americans | 0.0 /100 | #340 | Tragic $44,381 |
| Houma | 0.0 /100 | #341 | Tragic $44,356 |
| Arapaho | 0.0 /100 | #342 | Tragic $44,003 |
| Immigrants | Yemen | 0.0 /100 | #343 | Tragic $43,591 |
| Immigrants | Congo | 0.0 /100 | #344 | Tragic $43,266 |
| Navajo | 0.0 /100 | #345 | Tragic $42,380 |
| Puerto Ricans | 0.0 /100 | #346 | Tragic $39,726 |