Immigrants from Egypt vs Egyptian Householder Income Under 25 years
COMPARE
Immigrants from Egypt
Egyptian
Householder Income Under 25 years
Householder Income Under 25 years Comparison
Immigrants from Egypt
Egyptians
$54,239
HOUSEHOLDER INCOME UNDER 25 YEARS
99.3/ 100
METRIC RATING
91st/ 347
METRIC RANK
$54,444
HOUSEHOLDER INCOME UNDER 25 YEARS
99.6/ 100
METRIC RATING
80th/ 347
METRIC RANK
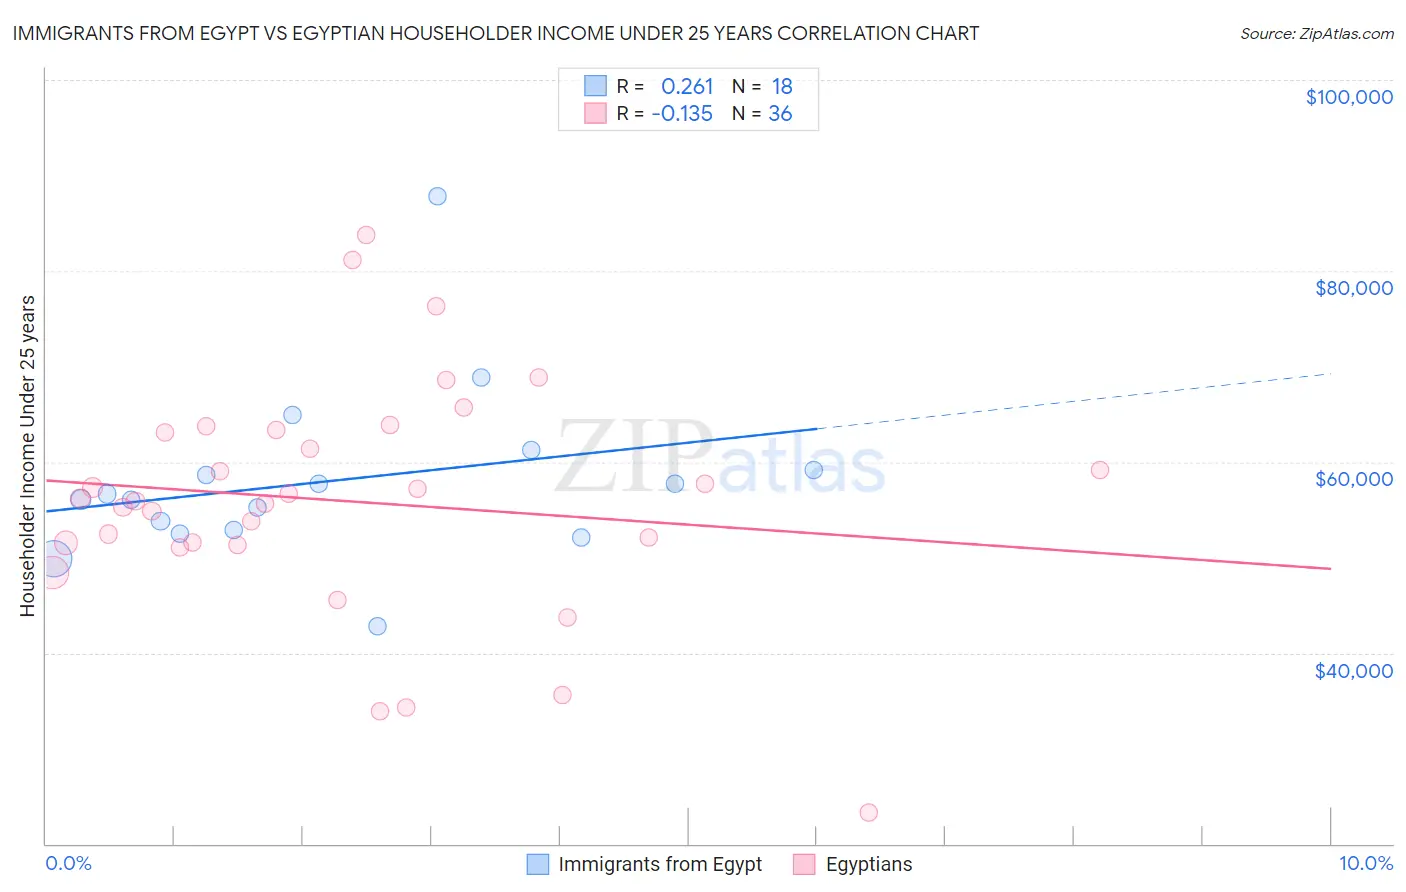
Immigrants from Egypt vs Egyptian Householder Income Under 25 years Correlation Chart
The statistical analysis conducted on geographies consisting of 213,516,119 people shows a weak positive correlation between the proportion of Immigrants from Egypt and household income with householder under the age of 25 in the United States with a correlation coefficient (R) of 0.261 and weighted average of $54,239. Similarly, the statistical analysis conducted on geographies consisting of 240,038,174 people shows a poor negative correlation between the proportion of Egyptians and household income with householder under the age of 25 in the United States with a correlation coefficient (R) of -0.135 and weighted average of $54,444, a difference of 0.38%.
Householder Income Under 25 years Correlation Summary
| Measurement | Immigrants from Egypt | Egyptian |
| Minimum | $42,805 | $23,214 |
| Maximum | $87,806 | $83,750 |
| Range | $45,001 | $60,536 |
| Mean | $57,981 | $55,910 |
| Median | $56,325 | $56,055 |
| Interquartile 25% (IQ1) | $52,891 | $51,447 |
| Interquartile 75% (IQ3) | $59,154 | $63,229 |
| Interquartile Range (IQR) | $6,263 | $11,783 |
| Standard Deviation (Sample) | $9,359 | $12,425 |
| Standard Deviation (Population) | $9,095 | $12,251 |
Demographics Similar to Immigrants from Egypt and Egyptians by Householder Income Under 25 years
In terms of householder income under 25 years, the demographic groups most similar to Immigrants from Egypt are Immigrants from St. Vincent and the Grenadines ($54,230, a difference of 0.020%), Immigrants from South America ($54,268, a difference of 0.050%), Turkish ($54,266, a difference of 0.050%), Immigrants from Argentina ($54,209, a difference of 0.050%), and Immigrants from Sierra Leone ($54,190, a difference of 0.090%). Similarly, the demographic groups most similar to Egyptians are Immigrants from Italy ($54,449, a difference of 0.010%), Portuguese ($54,436, a difference of 0.010%), Nepalese ($54,472, a difference of 0.050%), Immigrants from Southern Europe ($54,484, a difference of 0.070%), and Immigrants from Brazil ($54,487, a difference of 0.080%).
| Demographics | Rating | Rank | Householder Income Under 25 years |
| Immigrants | Sri Lanka | 99.7 /100 | #75 | Exceptional $54,512 |
| Immigrants | Brazil | 99.6 /100 | #76 | Exceptional $54,487 |
| Immigrants | Southern Europe | 99.6 /100 | #77 | Exceptional $54,484 |
| Nepalese | 99.6 /100 | #78 | Exceptional $54,472 |
| Immigrants | Italy | 99.6 /100 | #79 | Exceptional $54,449 |
| Egyptians | 99.6 /100 | #80 | Exceptional $54,444 |
| Portuguese | 99.6 /100 | #81 | Exceptional $54,436 |
| Russians | 99.5 /100 | #82 | Exceptional $54,389 |
| Laotians | 99.5 /100 | #83 | Exceptional $54,369 |
| Bulgarians | 99.5 /100 | #84 | Exceptional $54,352 |
| Immigrants | Czechoslovakia | 99.5 /100 | #85 | Exceptional $54,352 |
| Immigrants | Croatia | 99.5 /100 | #86 | Exceptional $54,343 |
| Brazilians | 99.5 /100 | #87 | Exceptional $54,335 |
| Yakama | 99.5 /100 | #88 | Exceptional $54,321 |
| Immigrants | South America | 99.4 /100 | #89 | Exceptional $54,268 |
| Turks | 99.4 /100 | #90 | Exceptional $54,266 |
| Immigrants | Egypt | 99.3 /100 | #91 | Exceptional $54,239 |
| Immigrants | St. Vincent and the Grenadines | 99.3 /100 | #92 | Exceptional $54,230 |
| Immigrants | Argentina | 99.3 /100 | #93 | Exceptional $54,209 |
| Immigrants | Sierra Leone | 99.3 /100 | #94 | Exceptional $54,190 |
| Immigrants | Malaysia | 99.2 /100 | #95 | Exceptional $54,179 |