Syrian vs Immigrants from the Azores Householder Income Under 25 years
COMPARE
Syrian
Immigrants from the Azores
Householder Income Under 25 years
Householder Income Under 25 years Comparison
Syrians
Immigrants from the Azores
$51,353
HOUSEHOLDER INCOME UNDER 25 YEARS
11.4/ 100
METRIC RATING
209th/ 347
METRIC RANK
$52,621
HOUSEHOLDER INCOME UNDER 25 YEARS
74.2/ 100
METRIC RATING
154th/ 347
METRIC RANK
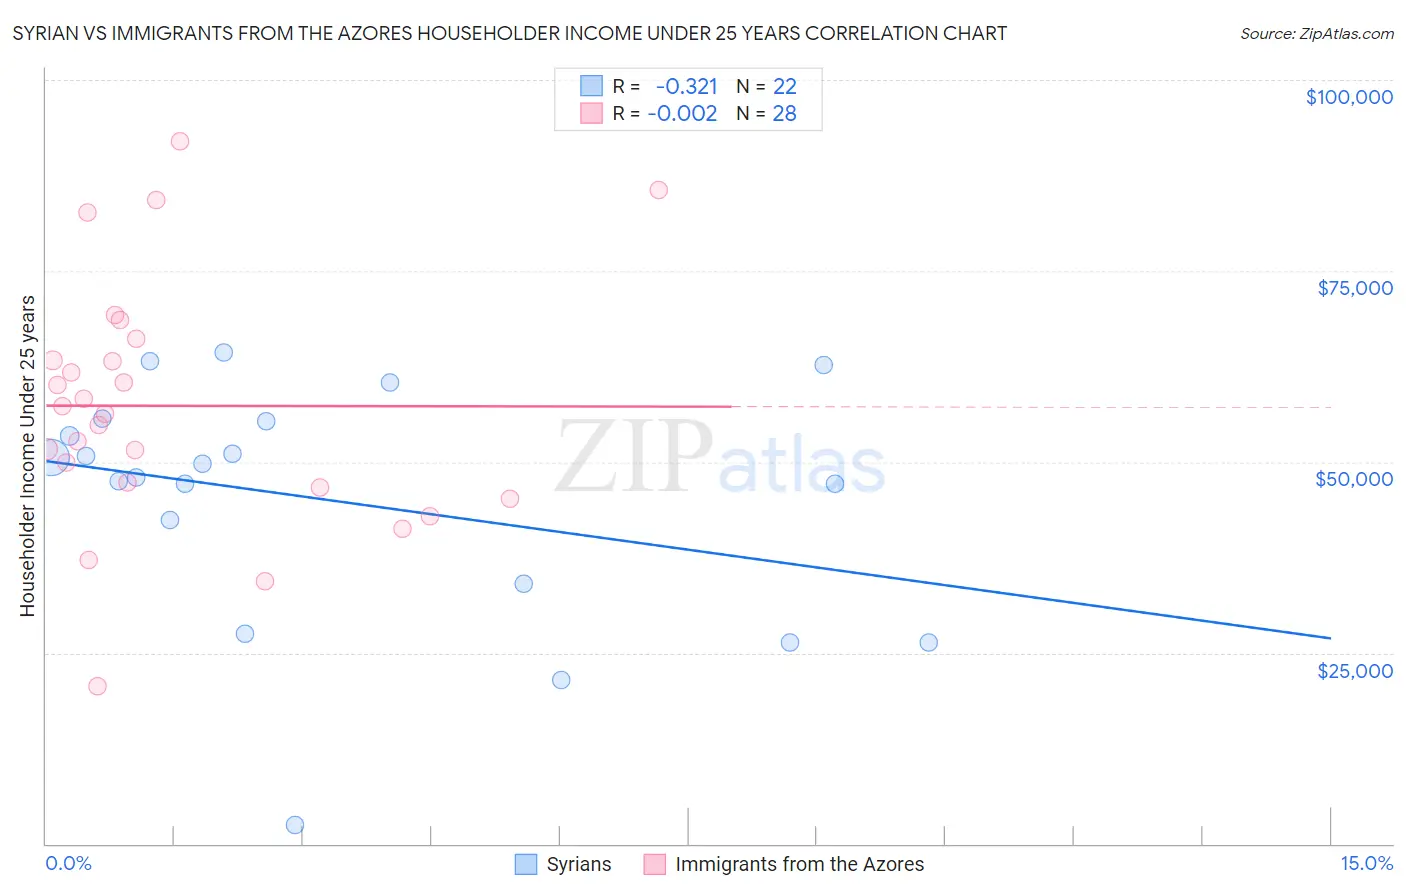
Syrian vs Immigrants from the Azores Householder Income Under 25 years Correlation Chart
The statistical analysis conducted on geographies consisting of 232,232,125 people shows a mild negative correlation between the proportion of Syrians and household income with householder under the age of 25 in the United States with a correlation coefficient (R) of -0.321 and weighted average of $51,353. Similarly, the statistical analysis conducted on geographies consisting of 40,962,746 people shows no correlation between the proportion of Immigrants from the Azores and household income with householder under the age of 25 in the United States with a correlation coefficient (R) of -0.002 and weighted average of $52,621, a difference of 2.5%.
Householder Income Under 25 years Correlation Summary
| Measurement | Syrian | Immigrants from the Azores |
| Minimum | $2,499 | $20,652 |
| Maximum | $64,366 | $91,938 |
| Range | $61,867 | $71,286 |
| Mean | $44,870 | $57,341 |
| Median | $48,867 | $56,819 |
| Interquartile 25% (IQ1) | $33,995 | $46,997 |
| Interquartile 75% (IQ3) | $55,261 | $64,729 |
| Interquartile Range (IQR) | $21,267 | $17,732 |
| Standard Deviation (Sample) | $15,709 | $16,204 |
| Standard Deviation (Population) | $15,348 | $15,912 |
Similar Demographics by Householder Income Under 25 years
Demographics Similar to Syrians by Householder Income Under 25 years
In terms of householder income under 25 years, the demographic groups most similar to Syrians are Immigrants from Jordan ($51,370, a difference of 0.030%), Immigrants from Ghana ($51,333, a difference of 0.040%), South African ($51,383, a difference of 0.060%), Cape Verdean ($51,387, a difference of 0.070%), and Immigrants from Latin America ($51,387, a difference of 0.070%).
| Demographics | Rating | Rank | Householder Income Under 25 years |
| Immigrants | Guatemala | 14.0 /100 | #202 | Poor $51,447 |
| Immigrants | Cameroon | 13.6 /100 | #203 | Poor $51,433 |
| Czechs | 13.2 /100 | #204 | Poor $51,421 |
| Cape Verdeans | 12.3 /100 | #205 | Poor $51,387 |
| Immigrants | Latin America | 12.3 /100 | #206 | Poor $51,387 |
| South Africans | 12.2 /100 | #207 | Poor $51,383 |
| Immigrants | Jordan | 11.9 /100 | #208 | Poor $51,370 |
| Syrians | 11.4 /100 | #209 | Poor $51,353 |
| Immigrants | Ghana | 10.9 /100 | #210 | Poor $51,333 |
| Irish | 10.6 /100 | #211 | Poor $51,317 |
| Immigrants | Panama | 9.7 /100 | #212 | Tragic $51,278 |
| Dutch | 9.4 /100 | #213 | Tragic $51,265 |
| Zimbabweans | 9.3 /100 | #214 | Tragic $51,259 |
| Icelanders | 9.1 /100 | #215 | Tragic $51,247 |
| French | 8.7 /100 | #216 | Tragic $51,230 |
Demographics Similar to Immigrants from the Azores by Householder Income Under 25 years
In terms of householder income under 25 years, the demographic groups most similar to Immigrants from the Azores are Central American ($52,626, a difference of 0.010%), Trinidadian and Tobagonian ($52,631, a difference of 0.020%), Immigrants from Denmark ($52,612, a difference of 0.020%), Immigrants from Nepal ($52,611, a difference of 0.020%), and Immigrants from Scotland ($52,638, a difference of 0.030%).
| Demographics | Rating | Rank | Householder Income Under 25 years |
| Latvians | 81.0 /100 | #147 | Excellent $52,783 |
| French Canadians | 76.5 /100 | #148 | Good $52,672 |
| Scandinavians | 75.7 /100 | #149 | Good $52,654 |
| Immigrants | Costa Rica | 75.2 /100 | #150 | Good $52,643 |
| Immigrants | Scotland | 75.0 /100 | #151 | Good $52,638 |
| Trinidadians and Tobagonians | 74.6 /100 | #152 | Good $52,631 |
| Central Americans | 74.4 /100 | #153 | Good $52,626 |
| Immigrants | Azores | 74.2 /100 | #154 | Good $52,621 |
| Immigrants | Denmark | 73.8 /100 | #155 | Good $52,612 |
| Immigrants | Nepal | 73.7 /100 | #156 | Good $52,611 |
| Ghanaians | 72.9 /100 | #157 | Good $52,594 |
| Immigrants | Netherlands | 72.8 /100 | #158 | Good $52,592 |
| Mongolians | 70.2 /100 | #159 | Good $52,540 |
| Immigrants | Turkey | 68.3 /100 | #160 | Good $52,503 |
| Uruguayans | 66.2 /100 | #161 | Good $52,465 |