Spanish vs Immigrants from India Median Family Income
COMPARE
Spanish
Immigrants from India
Median Family Income
Median Family Income Comparison
Spanish
Immigrants from India
$99,977
MEDIAN FAMILY INCOME
20.1/ 100
METRIC RATING
200th/ 347
METRIC RANK
$134,028
MEDIAN FAMILY INCOME
100.0/ 100
METRIC RATING
4th/ 347
METRIC RANK
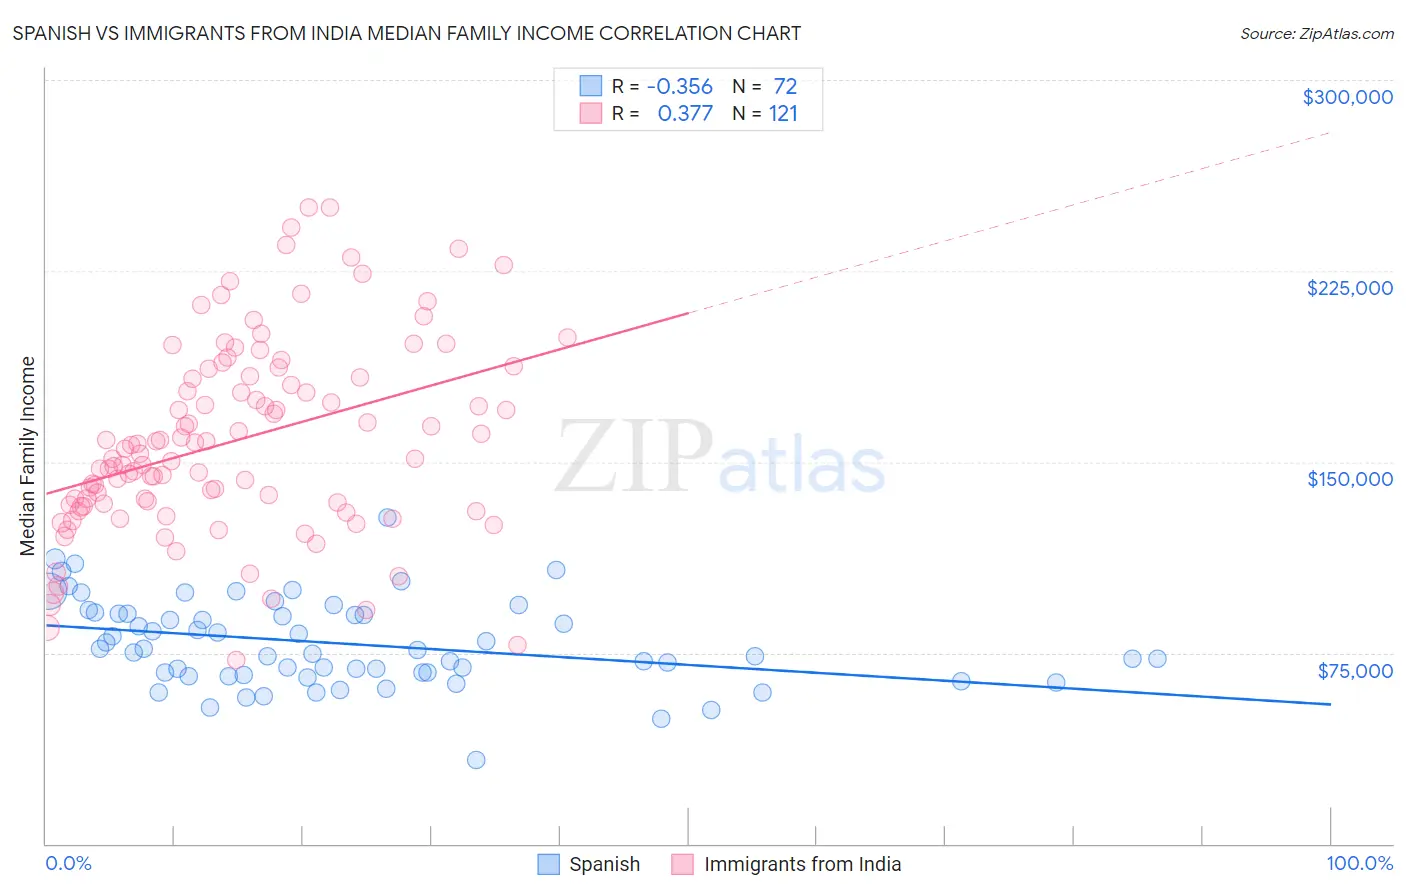
Spanish vs Immigrants from India Median Family Income Correlation Chart
The statistical analysis conducted on geographies consisting of 421,758,667 people shows a mild negative correlation between the proportion of Spanish and median family income in the United States with a correlation coefficient (R) of -0.356 and weighted average of $99,977. Similarly, the statistical analysis conducted on geographies consisting of 433,562,423 people shows a mild positive correlation between the proportion of Immigrants from India and median family income in the United States with a correlation coefficient (R) of 0.377 and weighted average of $134,028, a difference of 34.1%.
Median Family Income Correlation Summary
| Measurement | Spanish | Immigrants from India |
| Minimum | $32,992 | $71,983 |
| Maximum | $127,945 | $250,001 |
| Range | $94,953 | $178,018 |
| Mean | $78,597 | $158,155 |
| Median | $75,704 | $153,095 |
| Interquartile 25% (IQ1) | $66,829 | $132,876 |
| Interquartile 75% (IQ3) | $90,296 | $183,418 |
| Interquartile Range (IQR) | $23,466 | $50,542 |
| Standard Deviation (Sample) | $17,174 | $37,573 |
| Standard Deviation (Population) | $17,054 | $37,418 |
Similar Demographics by Median Family Income
Demographics Similar to Spanish by Median Family Income
In terms of median family income, the demographic groups most similar to Spanish are Yugoslavian ($100,119, a difference of 0.14%), Immigrants from Thailand ($99,840, a difference of 0.14%), White/Caucasian ($99,800, a difference of 0.18%), Immigrants from Africa ($100,256, a difference of 0.28%), and Immigrants from Cameroon ($100,289, a difference of 0.31%).
| Demographics | Rating | Rank | Median Family Income |
| Iraqis | 26.3 /100 | #193 | Fair $100,658 |
| Uruguayans | 26.3 /100 | #194 | Fair $100,656 |
| Immigrants | South America | 23.9 /100 | #195 | Fair $100,414 |
| Samoans | 23.3 /100 | #196 | Fair $100,344 |
| Immigrants | Cameroon | 22.8 /100 | #197 | Fair $100,289 |
| Immigrants | Africa | 22.5 /100 | #198 | Fair $100,256 |
| Yugoslavians | 21.3 /100 | #199 | Fair $100,119 |
| Spanish | 20.1 /100 | #200 | Fair $99,977 |
| Immigrants | Thailand | 19.0 /100 | #201 | Poor $99,840 |
| Whites/Caucasians | 18.7 /100 | #202 | Poor $99,800 |
| Scotch-Irish | 17.1 /100 | #203 | Poor $99,591 |
| Ghanaians | 12.6 /100 | #204 | Poor $98,877 |
| Hawaiians | 12.5 /100 | #205 | Poor $98,869 |
| Immigrants | Iraq | 12.1 /100 | #206 | Poor $98,786 |
| Aleuts | 11.6 /100 | #207 | Poor $98,702 |
Demographics Similar to Immigrants from India by Median Family Income
In terms of median family income, the demographic groups most similar to Immigrants from India are Iranian ($133,839, a difference of 0.14%), Immigrants from Singapore ($134,818, a difference of 0.59%), Thai ($131,281, a difference of 2.1%), Immigrants from Taiwan ($136,949, a difference of 2.2%), and Immigrants from Hong Kong ($131,067, a difference of 2.3%).
| Demographics | Rating | Rank | Median Family Income |
| Filipinos | 100.0 /100 | #1 | Exceptional $138,397 |
| Immigrants | Taiwan | 100.0 /100 | #2 | Exceptional $136,949 |
| Immigrants | Singapore | 100.0 /100 | #3 | Exceptional $134,818 |
| Immigrants | India | 100.0 /100 | #4 | Exceptional $134,028 |
| Iranians | 100.0 /100 | #5 | Exceptional $133,839 |
| Thais | 100.0 /100 | #6 | Exceptional $131,281 |
| Immigrants | Hong Kong | 100.0 /100 | #7 | Exceptional $131,067 |
| Immigrants | Iran | 100.0 /100 | #8 | Exceptional $130,894 |
| Okinawans | 100.0 /100 | #9 | Exceptional $129,979 |
| Immigrants | Ireland | 100.0 /100 | #10 | Exceptional $127,584 |
| Immigrants | Israel | 100.0 /100 | #11 | Exceptional $127,430 |
| Cypriots | 100.0 /100 | #12 | Exceptional $127,064 |
| Immigrants | Australia | 100.0 /100 | #13 | Exceptional $126,620 |
| Immigrants | South Central Asia | 100.0 /100 | #14 | Exceptional $125,956 |
| Eastern Europeans | 100.0 /100 | #15 | Exceptional $125,546 |