Somali vs Immigrants from Guyana Median Male Earnings
COMPARE
Somali
Immigrants from Guyana
Median Male Earnings
Median Male Earnings Comparison
Somalis
Immigrants from Guyana
$49,025
MEDIAN MALE EARNINGS
0.5/ 100
METRIC RATING
266th/ 347
METRIC RANK
$50,321
MEDIAN MALE EARNINGS
1.6/ 100
METRIC RATING
248th/ 347
METRIC RANK
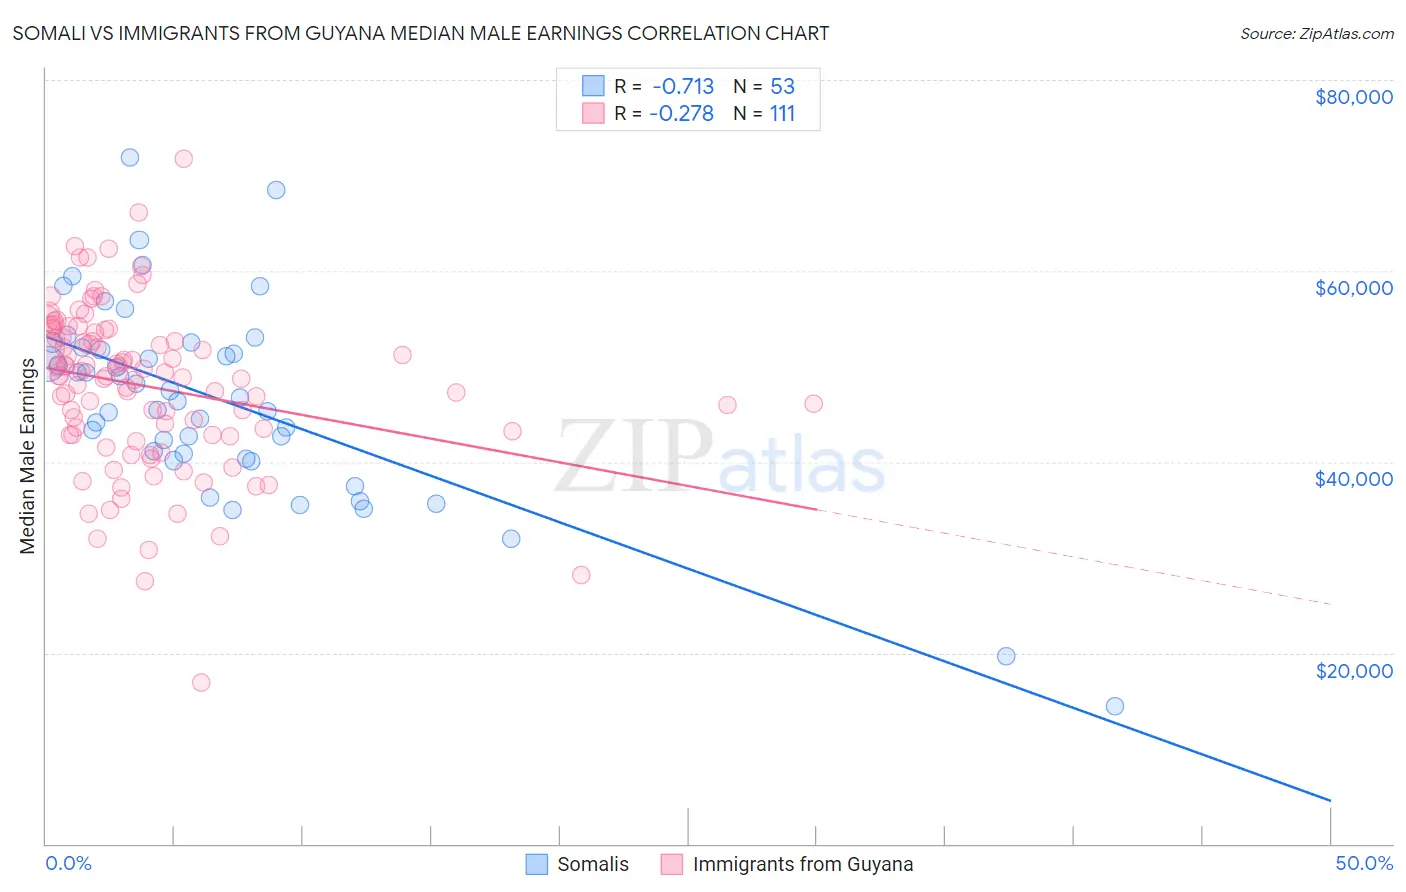
Somali vs Immigrants from Guyana Median Male Earnings Correlation Chart
The statistical analysis conducted on geographies consisting of 99,323,068 people shows a strong negative correlation between the proportion of Somalis and median male earnings in the United States with a correlation coefficient (R) of -0.713 and weighted average of $49,025. Similarly, the statistical analysis conducted on geographies consisting of 183,717,574 people shows a weak negative correlation between the proportion of Immigrants from Guyana and median male earnings in the United States with a correlation coefficient (R) of -0.278 and weighted average of $50,321, a difference of 2.6%.
Median Male Earnings Correlation Summary
| Measurement | Somali | Immigrants from Guyana |
| Minimum | $14,382 | $16,923 |
| Maximum | $71,947 | $71,805 |
| Range | $57,565 | $54,882 |
| Mean | $46,539 | $47,916 |
| Median | $46,803 | $49,022 |
| Interquartile 25% (IQ1) | $40,598 | $42,798 |
| Interquartile 75% (IQ3) | $52,221 | $53,585 |
| Interquartile Range (IQR) | $11,623 | $10,787 |
| Standard Deviation (Sample) | $10,412 | $8,575 |
| Standard Deviation (Population) | $10,313 | $8,536 |
Demographics Similar to Somalis and Immigrants from Guyana by Median Male Earnings
In terms of median male earnings, the demographic groups most similar to Somalis are Spanish American ($49,008, a difference of 0.040%), Immigrants from Laos ($49,190, a difference of 0.34%), Immigrants from Middle Africa ($49,201, a difference of 0.36%), Nicaraguan ($49,215, a difference of 0.39%), and Immigrants from West Indies ($49,271, a difference of 0.50%). Similarly, the demographic groups most similar to Immigrants from Guyana are Immigrants from Burma/Myanmar ($50,298, a difference of 0.050%), Osage ($50,292, a difference of 0.060%), Immigrants from Grenada ($50,279, a difference of 0.080%), Subsaharan African ($50,408, a difference of 0.17%), and Immigrants from Cabo Verde ($50,009, a difference of 0.63%).
| Demographics | Rating | Rank | Median Male Earnings |
| Sub-Saharan Africans | 1.8 /100 | #247 | Tragic $50,408 |
| Immigrants | Guyana | 1.6 /100 | #248 | Tragic $50,321 |
| Immigrants | Burma/Myanmar | 1.6 /100 | #249 | Tragic $50,298 |
| Osage | 1.6 /100 | #250 | Tragic $50,292 |
| Immigrants | Grenada | 1.6 /100 | #251 | Tragic $50,279 |
| Immigrants | Cabo Verde | 1.2 /100 | #252 | Tragic $50,009 |
| German Russians | 1.1 /100 | #253 | Tragic $49,924 |
| Senegalese | 1.0 /100 | #254 | Tragic $49,774 |
| Alaskan Athabascans | 0.9 /100 | #255 | Tragic $49,748 |
| Alaska Natives | 0.9 /100 | #256 | Tragic $49,711 |
| British West Indians | 0.8 /100 | #257 | Tragic $49,636 |
| Cree | 0.7 /100 | #258 | Tragic $49,497 |
| Nepalese | 0.7 /100 | #259 | Tragic $49,458 |
| Iroquois | 0.7 /100 | #260 | Tragic $49,374 |
| Liberians | 0.6 /100 | #261 | Tragic $49,318 |
| Immigrants | West Indies | 0.6 /100 | #262 | Tragic $49,271 |
| Nicaraguans | 0.6 /100 | #263 | Tragic $49,215 |
| Immigrants | Middle Africa | 0.6 /100 | #264 | Tragic $49,201 |
| Immigrants | Laos | 0.6 /100 | #265 | Tragic $49,190 |
| Somalis | 0.5 /100 | #266 | Tragic $49,025 |
| Spanish Americans | 0.5 /100 | #267 | Tragic $49,008 |