Somali vs Immigrants from Poland Median Male Earnings
COMPARE
Somali
Immigrants from Poland
Median Male Earnings
Median Male Earnings Comparison
Somalis
Immigrants from Poland
$49,025
MEDIAN MALE EARNINGS
0.5/ 100
METRIC RATING
266th/ 347
METRIC RANK
$58,452
MEDIAN MALE EARNINGS
98.0/ 100
METRIC RATING
99th/ 347
METRIC RANK
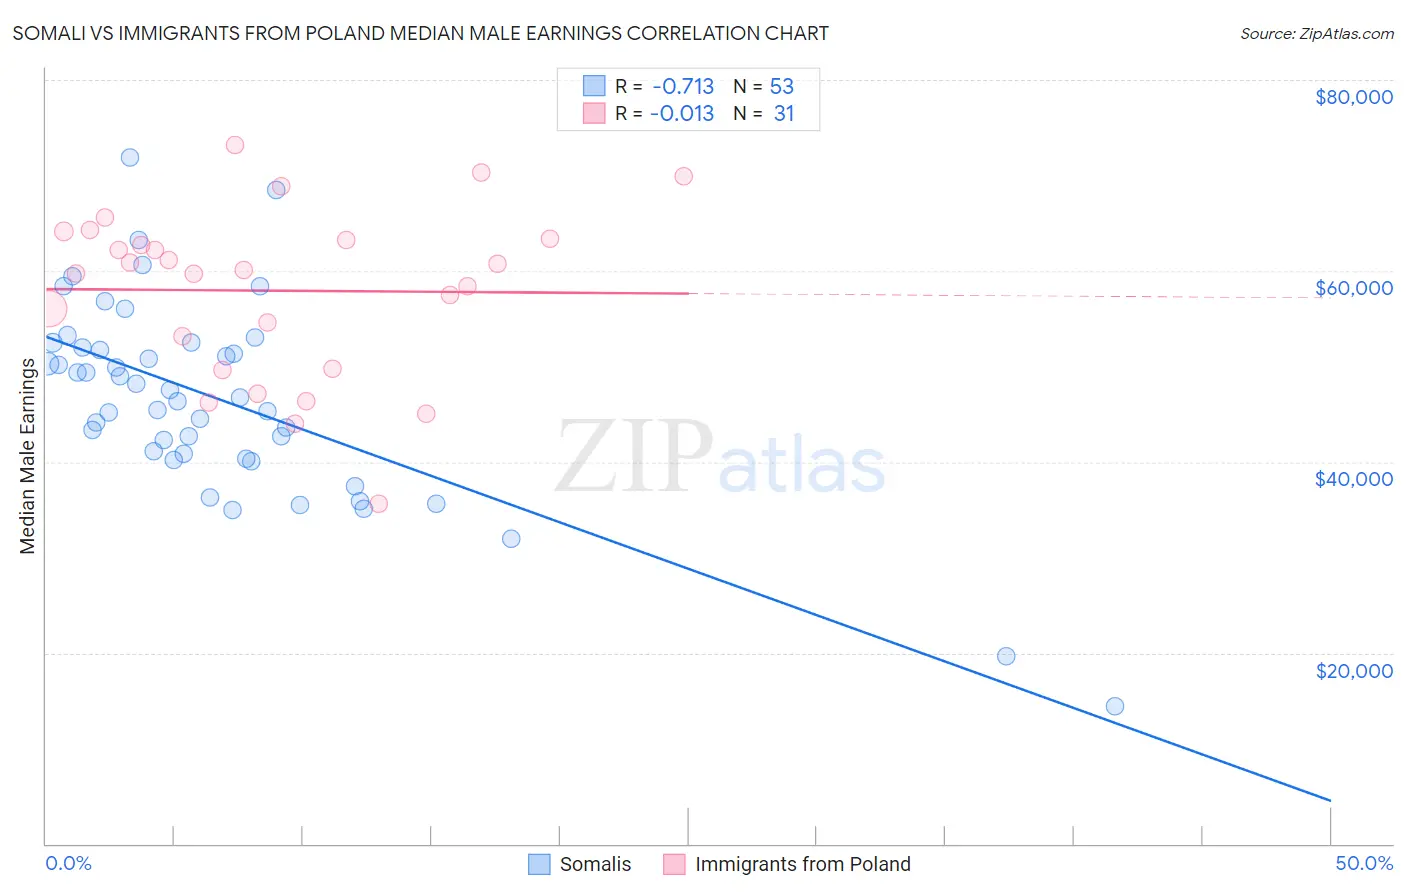
Somali vs Immigrants from Poland Median Male Earnings Correlation Chart
The statistical analysis conducted on geographies consisting of 99,323,068 people shows a strong negative correlation between the proportion of Somalis and median male earnings in the United States with a correlation coefficient (R) of -0.713 and weighted average of $49,025. Similarly, the statistical analysis conducted on geographies consisting of 304,780,508 people shows no correlation between the proportion of Immigrants from Poland and median male earnings in the United States with a correlation coefficient (R) of -0.013 and weighted average of $58,452, a difference of 19.2%.
Median Male Earnings Correlation Summary
| Measurement | Somali | Immigrants from Poland |
| Minimum | $14,382 | $35,574 |
| Maximum | $71,947 | $73,128 |
| Range | $57,565 | $37,554 |
| Mean | $46,539 | $57,933 |
| Median | $46,803 | $60,075 |
| Interquartile 25% (IQ1) | $40,598 | $49,798 |
| Interquartile 75% (IQ3) | $52,221 | $63,413 |
| Interquartile Range (IQR) | $11,623 | $13,615 |
| Standard Deviation (Sample) | $10,412 | $8,867 |
| Standard Deviation (Population) | $10,313 | $8,722 |
Similar Demographics by Median Male Earnings
Demographics Similar to Somalis by Median Male Earnings
In terms of median male earnings, the demographic groups most similar to Somalis are Spanish American ($49,008, a difference of 0.040%), Ute ($48,899, a difference of 0.26%), Immigrants from Laos ($49,190, a difference of 0.34%), Immigrants from Middle Africa ($49,201, a difference of 0.36%), and Nicaraguan ($49,215, a difference of 0.39%).
| Demographics | Rating | Rank | Median Male Earnings |
| Nepalese | 0.7 /100 | #259 | Tragic $49,458 |
| Iroquois | 0.7 /100 | #260 | Tragic $49,374 |
| Liberians | 0.6 /100 | #261 | Tragic $49,318 |
| Immigrants | West Indies | 0.6 /100 | #262 | Tragic $49,271 |
| Nicaraguans | 0.6 /100 | #263 | Tragic $49,215 |
| Immigrants | Middle Africa | 0.6 /100 | #264 | Tragic $49,201 |
| Immigrants | Laos | 0.6 /100 | #265 | Tragic $49,190 |
| Somalis | 0.5 /100 | #266 | Tragic $49,025 |
| Spanish Americans | 0.5 /100 | #267 | Tragic $49,008 |
| Ute | 0.4 /100 | #268 | Tragic $48,899 |
| Tsimshian | 0.4 /100 | #269 | Tragic $48,836 |
| Potawatomi | 0.4 /100 | #270 | Tragic $48,768 |
| Cherokee | 0.3 /100 | #271 | Tragic $48,669 |
| Salvadorans | 0.3 /100 | #272 | Tragic $48,646 |
| Jamaicans | 0.3 /100 | #273 | Tragic $48,632 |
Demographics Similar to Immigrants from Poland by Median Male Earnings
In terms of median male earnings, the demographic groups most similar to Immigrants from Poland are Assyrian/Chaldean/Syriac ($58,437, a difference of 0.030%), Jordanian ($58,500, a difference of 0.080%), Immigrants from Brazil ($58,324, a difference of 0.22%), Northern European ($58,588, a difference of 0.23%), and Albanian ($58,680, a difference of 0.39%).
| Demographics | Rating | Rank | Median Male Earnings |
| Immigrants | Kazakhstan | 99.1 /100 | #92 | Exceptional $59,278 |
| Immigrants | Southern Europe | 99.0 /100 | #93 | Exceptional $59,217 |
| Immigrants | North Macedonia | 99.0 /100 | #94 | Exceptional $59,189 |
| Immigrants | Lebanon | 98.6 /100 | #95 | Exceptional $58,835 |
| Albanians | 98.4 /100 | #96 | Exceptional $58,680 |
| Northern Europeans | 98.2 /100 | #97 | Exceptional $58,588 |
| Jordanians | 98.1 /100 | #98 | Exceptional $58,500 |
| Immigrants | Poland | 98.0 /100 | #99 | Exceptional $58,452 |
| Assyrians/Chaldeans/Syriacs | 97.9 /100 | #100 | Exceptional $58,437 |
| Immigrants | Brazil | 97.7 /100 | #101 | Exceptional $58,324 |
| Syrians | 97.4 /100 | #102 | Exceptional $58,187 |
| Poles | 97.3 /100 | #103 | Exceptional $58,139 |
| Armenians | 97.3 /100 | #104 | Exceptional $58,134 |
| Immigrants | Western Asia | 97.3 /100 | #105 | Exceptional $58,131 |
| Immigrants | Northern Africa | 96.9 /100 | #106 | Exceptional $58,008 |