Cheyenne vs Immigrants from Poland Median Male Earnings
COMPARE
Cheyenne
Immigrants from Poland
Median Male Earnings
Median Male Earnings Comparison
Cheyenne
Immigrants from Poland
$46,062
MEDIAN MALE EARNINGS
0.0/ 100
METRIC RATING
318th/ 347
METRIC RANK
$58,452
MEDIAN MALE EARNINGS
98.0/ 100
METRIC RATING
99th/ 347
METRIC RANK
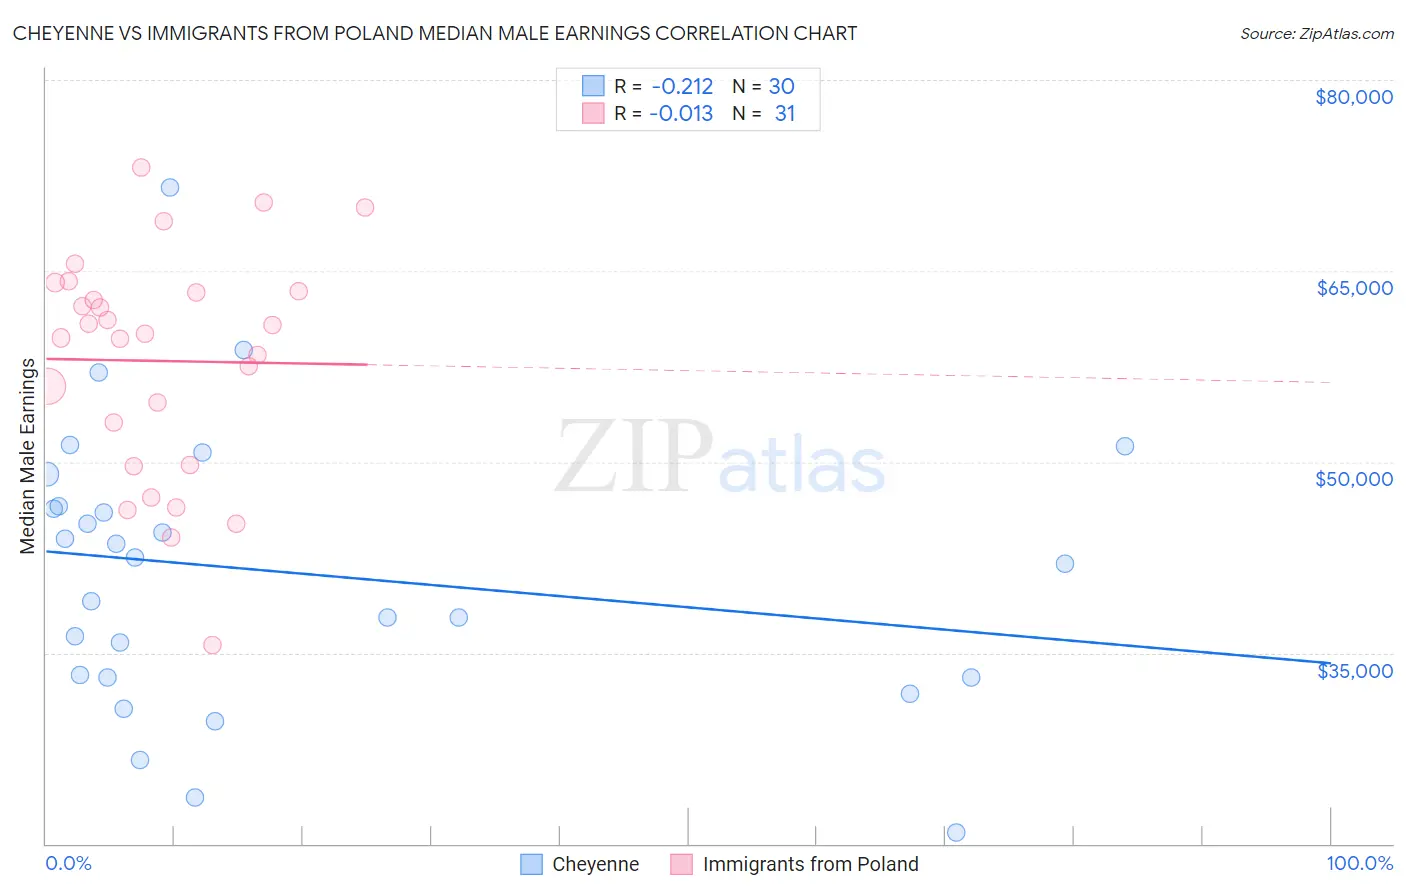
Cheyenne vs Immigrants from Poland Median Male Earnings Correlation Chart
The statistical analysis conducted on geographies consisting of 80,706,071 people shows a weak negative correlation between the proportion of Cheyenne and median male earnings in the United States with a correlation coefficient (R) of -0.212 and weighted average of $46,062. Similarly, the statistical analysis conducted on geographies consisting of 304,780,508 people shows no correlation between the proportion of Immigrants from Poland and median male earnings in the United States with a correlation coefficient (R) of -0.013 and weighted average of $58,452, a difference of 26.9%.
Median Male Earnings Correlation Summary
| Measurement | Cheyenne | Immigrants from Poland |
| Minimum | $20,903 | $35,574 |
| Maximum | $71,550 | $73,128 |
| Range | $50,647 | $37,554 |
| Mean | $41,316 | $57,933 |
| Median | $42,260 | $60,075 |
| Interquartile 25% (IQ1) | $33,100 | $49,798 |
| Interquartile 75% (IQ3) | $46,481 | $63,413 |
| Interquartile Range (IQR) | $13,381 | $13,615 |
| Standard Deviation (Sample) | $10,984 | $8,867 |
| Standard Deviation (Population) | $10,799 | $8,722 |
Similar Demographics by Median Male Earnings
Demographics Similar to Cheyenne by Median Male Earnings
In terms of median male earnings, the demographic groups most similar to Cheyenne are Mexican ($46,147, a difference of 0.18%), Immigrants from Caribbean ($46,193, a difference of 0.28%), Haitian ($45,903, a difference of 0.35%), Immigrants from Guatemala ($46,244, a difference of 0.39%), and Immigrants from Honduras ($45,787, a difference of 0.60%).
| Demographics | Rating | Rank | Median Male Earnings |
| Apache | 0.0 /100 | #311 | Tragic $46,429 |
| Hispanics or Latinos | 0.0 /100 | #312 | Tragic $46,419 |
| Hondurans | 0.0 /100 | #313 | Tragic $46,374 |
| Chippewa | 0.0 /100 | #314 | Tragic $46,368 |
| Immigrants | Guatemala | 0.0 /100 | #315 | Tragic $46,244 |
| Immigrants | Caribbean | 0.0 /100 | #316 | Tragic $46,193 |
| Mexicans | 0.0 /100 | #317 | Tragic $46,147 |
| Cheyenne | 0.0 /100 | #318 | Tragic $46,062 |
| Haitians | 0.0 /100 | #319 | Tragic $45,903 |
| Immigrants | Honduras | 0.0 /100 | #320 | Tragic $45,787 |
| Fijians | 0.0 /100 | #321 | Tragic $45,607 |
| Sioux | 0.0 /100 | #322 | Tragic $45,566 |
| Immigrants | Central America | 0.0 /100 | #323 | Tragic $45,538 |
| Blacks/African Americans | 0.0 /100 | #324 | Tragic $45,523 |
| Yuman | 0.0 /100 | #325 | Tragic $45,446 |
Demographics Similar to Immigrants from Poland by Median Male Earnings
In terms of median male earnings, the demographic groups most similar to Immigrants from Poland are Assyrian/Chaldean/Syriac ($58,437, a difference of 0.030%), Jordanian ($58,500, a difference of 0.080%), Immigrants from Brazil ($58,324, a difference of 0.22%), Northern European ($58,588, a difference of 0.23%), and Albanian ($58,680, a difference of 0.39%).
| Demographics | Rating | Rank | Median Male Earnings |
| Immigrants | Kazakhstan | 99.1 /100 | #92 | Exceptional $59,278 |
| Immigrants | Southern Europe | 99.0 /100 | #93 | Exceptional $59,217 |
| Immigrants | North Macedonia | 99.0 /100 | #94 | Exceptional $59,189 |
| Immigrants | Lebanon | 98.6 /100 | #95 | Exceptional $58,835 |
| Albanians | 98.4 /100 | #96 | Exceptional $58,680 |
| Northern Europeans | 98.2 /100 | #97 | Exceptional $58,588 |
| Jordanians | 98.1 /100 | #98 | Exceptional $58,500 |
| Immigrants | Poland | 98.0 /100 | #99 | Exceptional $58,452 |
| Assyrians/Chaldeans/Syriacs | 97.9 /100 | #100 | Exceptional $58,437 |
| Immigrants | Brazil | 97.7 /100 | #101 | Exceptional $58,324 |
| Syrians | 97.4 /100 | #102 | Exceptional $58,187 |
| Poles | 97.3 /100 | #103 | Exceptional $58,139 |
| Armenians | 97.3 /100 | #104 | Exceptional $58,134 |
| Immigrants | Western Asia | 97.3 /100 | #105 | Exceptional $58,131 |
| Immigrants | Northern Africa | 96.9 /100 | #106 | Exceptional $58,008 |