Somali vs Immigrants from Nepal Per Capita Income
COMPARE
Somali
Immigrants from Nepal
Per Capita Income
Per Capita Income Comparison
Somalis
Immigrants from Nepal
$40,367
PER CAPITA INCOME
2.4/ 100
METRIC RATING
238th/ 347
METRIC RANK
$44,187
PER CAPITA INCOME
64.3/ 100
METRIC RATING
158th/ 347
METRIC RANK
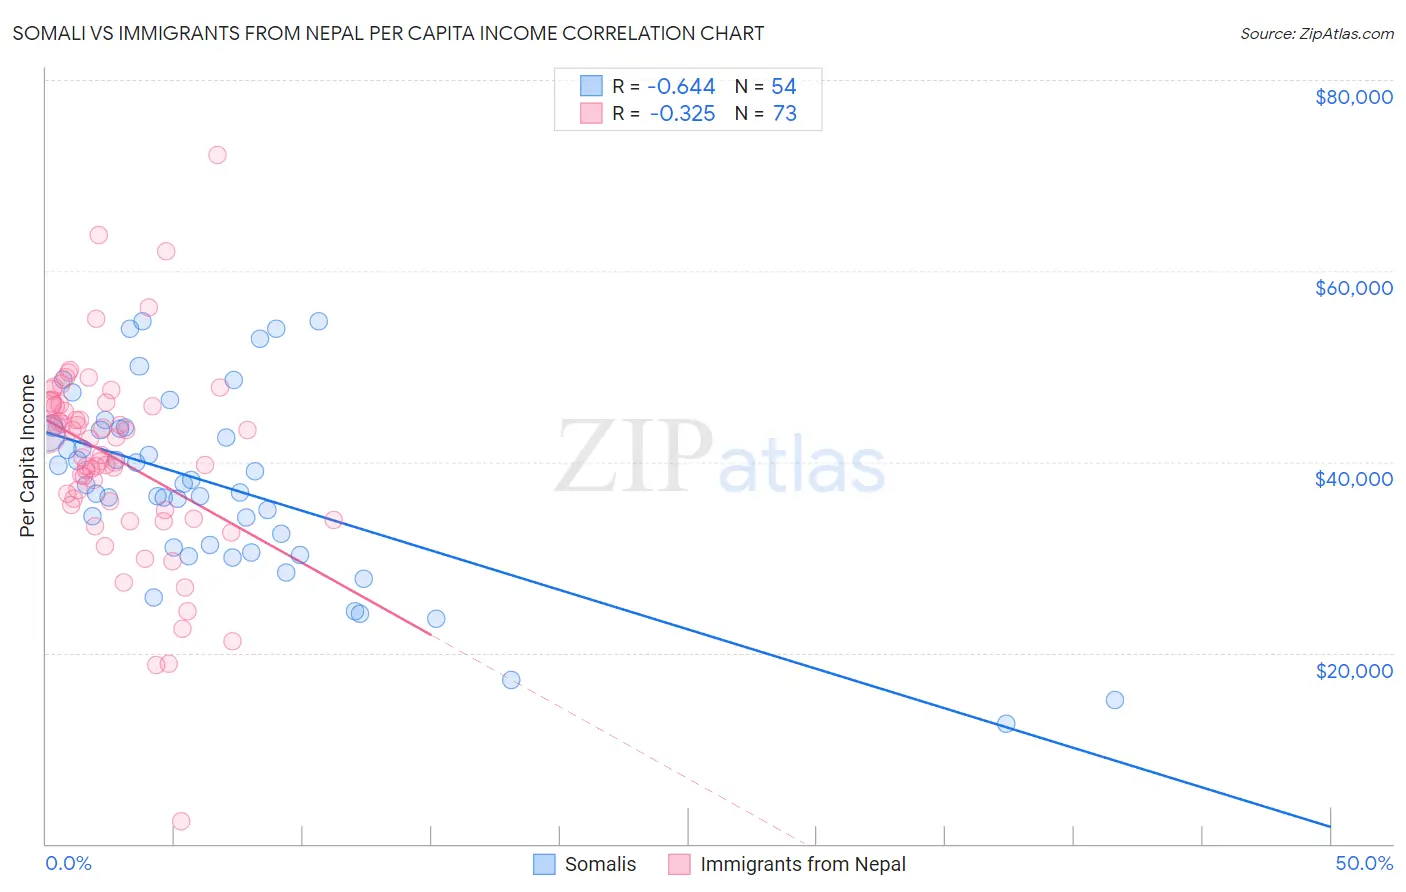
Somali vs Immigrants from Nepal Per Capita Income Correlation Chart
The statistical analysis conducted on geographies consisting of 99,334,522 people shows a significant negative correlation between the proportion of Somalis and per capita income in the United States with a correlation coefficient (R) of -0.644 and weighted average of $40,367. Similarly, the statistical analysis conducted on geographies consisting of 186,792,214 people shows a mild negative correlation between the proportion of Immigrants from Nepal and per capita income in the United States with a correlation coefficient (R) of -0.325 and weighted average of $44,187, a difference of 9.5%.
Per Capita Income Correlation Summary
| Measurement | Somali | Immigrants from Nepal |
| Minimum | $12,576 | $2,302 |
| Maximum | $54,740 | $72,138 |
| Range | $42,164 | $69,836 |
| Mean | $37,481 | $40,351 |
| Median | $37,654 | $40,773 |
| Interquartile 25% (IQ1) | $31,050 | $35,186 |
| Interquartile 75% (IQ3) | $43,455 | $46,005 |
| Interquartile Range (IQR) | $12,404 | $10,819 |
| Standard Deviation (Sample) | $9,737 | $10,460 |
| Standard Deviation (Population) | $9,647 | $10,388 |
Similar Demographics by Per Capita Income
Demographics Similar to Somalis by Per Capita Income
In terms of per capita income, the demographic groups most similar to Somalis are Tsimshian ($40,344, a difference of 0.060%), Immigrants from Nigeria ($40,339, a difference of 0.070%), British West Indian ($40,330, a difference of 0.090%), Immigrants from Cambodia ($40,434, a difference of 0.16%), and Immigrants from Western Africa ($40,294, a difference of 0.18%).
| Demographics | Rating | Rank | Per Capita Income |
| Senegalese | 4.8 /100 | #231 | Tragic $41,000 |
| Guyanese | 4.5 /100 | #232 | Tragic $40,949 |
| Delaware | 3.8 /100 | #233 | Tragic $40,778 |
| Immigrants | West Indies | 3.7 /100 | #234 | Tragic $40,763 |
| Immigrants | Guyana | 3.6 /100 | #235 | Tragic $40,742 |
| Immigrants | Nonimmigrants | 3.4 /100 | #236 | Tragic $40,669 |
| Immigrants | Cambodia | 2.6 /100 | #237 | Tragic $40,434 |
| Somalis | 2.4 /100 | #238 | Tragic $40,367 |
| Tsimshian | 2.4 /100 | #239 | Tragic $40,344 |
| Immigrants | Nigeria | 2.3 /100 | #240 | Tragic $40,339 |
| British West Indians | 2.3 /100 | #241 | Tragic $40,330 |
| Immigrants | Western Africa | 2.2 /100 | #242 | Tragic $40,294 |
| German Russians | 2.2 /100 | #243 | Tragic $40,266 |
| French American Indians | 2.1 /100 | #244 | Tragic $40,244 |
| Sub-Saharan Africans | 1.9 /100 | #245 | Tragic $40,152 |
Demographics Similar to Immigrants from Nepal by Per Capita Income
In terms of per capita income, the demographic groups most similar to Immigrants from Nepal are South American Indian ($44,206, a difference of 0.040%), Slovak ($44,229, a difference of 0.090%), South American ($44,114, a difference of 0.17%), Danish ($44,095, a difference of 0.21%), and Costa Rican ($44,090, a difference of 0.22%).
| Demographics | Rating | Rank | Per Capita Income |
| Norwegians | 71.5 /100 | #151 | Good $44,480 |
| Peruvians | 71.5 /100 | #152 | Good $44,479 |
| Scottish | 70.6 /100 | #153 | Good $44,440 |
| Portuguese | 68.7 /100 | #154 | Good $44,362 |
| Uruguayans | 67.6 /100 | #155 | Good $44,318 |
| Slovaks | 65.4 /100 | #156 | Good $44,229 |
| South American Indians | 64.8 /100 | #157 | Good $44,206 |
| Immigrants | Nepal | 64.3 /100 | #158 | Good $44,187 |
| South Americans | 62.4 /100 | #159 | Good $44,114 |
| Danes | 61.9 /100 | #160 | Good $44,095 |
| Costa Ricans | 61.8 /100 | #161 | Good $44,090 |
| Swiss | 61.4 /100 | #162 | Good $44,076 |
| Immigrants | South America | 61.2 /100 | #163 | Good $44,068 |
| Sri Lankans | 59.8 /100 | #164 | Average $44,014 |
| Immigrants | Philippines | 59.4 /100 | #165 | Average $44,000 |