Macedonian vs Immigrants from Nepal Per Capita Income
COMPARE
Macedonian
Immigrants from Nepal
Per Capita Income
Per Capita Income Comparison
Macedonians
Immigrants from Nepal
$47,573
PER CAPITA INCOME
98.8/ 100
METRIC RATING
91st/ 347
METRIC RANK
$44,187
PER CAPITA INCOME
64.3/ 100
METRIC RATING
158th/ 347
METRIC RANK
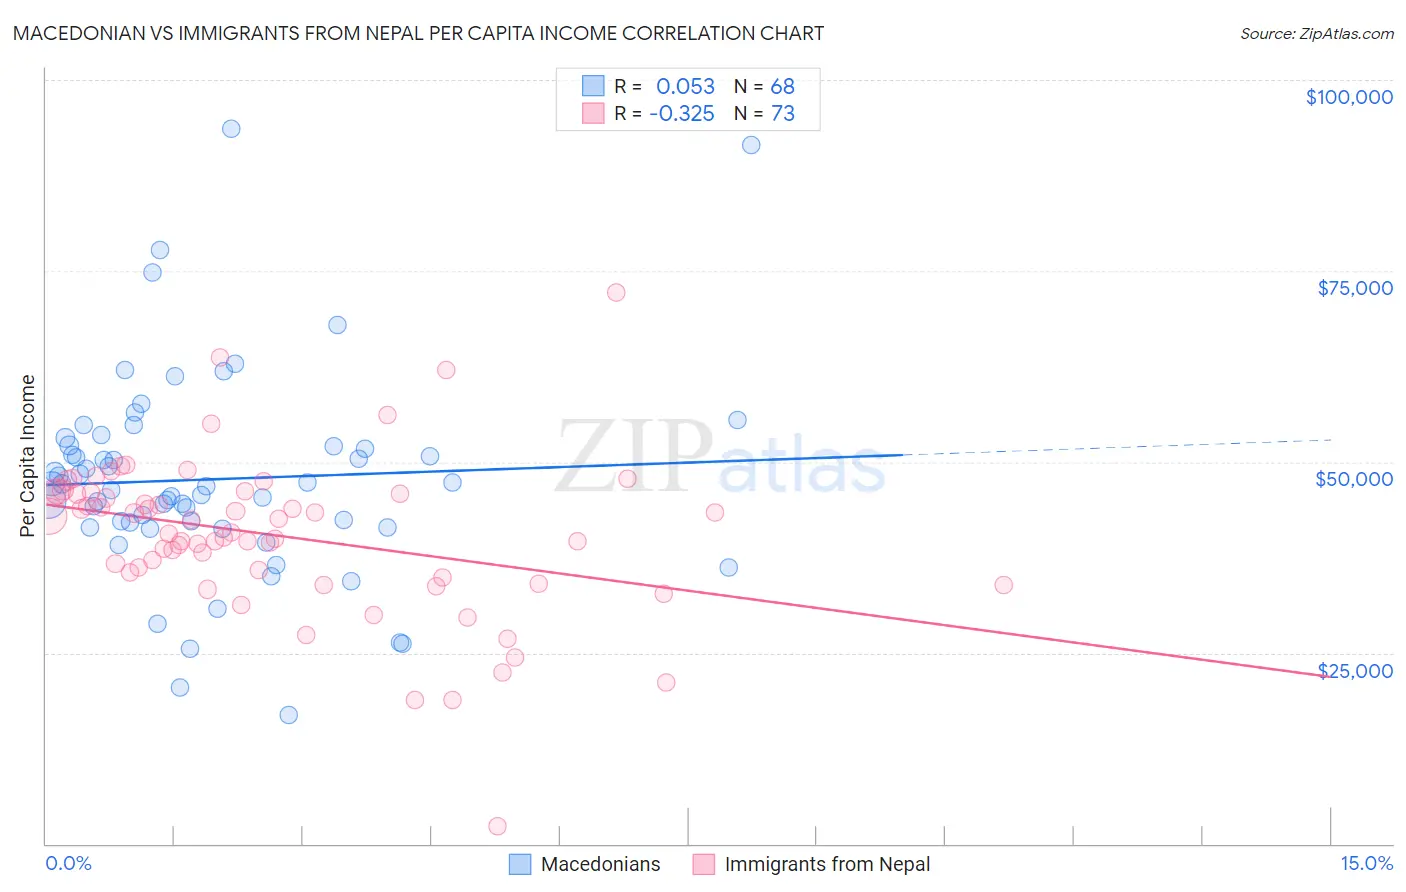
Macedonian vs Immigrants from Nepal Per Capita Income Correlation Chart
The statistical analysis conducted on geographies consisting of 132,587,632 people shows a slight positive correlation between the proportion of Macedonians and per capita income in the United States with a correlation coefficient (R) of 0.053 and weighted average of $47,573. Similarly, the statistical analysis conducted on geographies consisting of 186,792,214 people shows a mild negative correlation between the proportion of Immigrants from Nepal and per capita income in the United States with a correlation coefficient (R) of -0.325 and weighted average of $44,187, a difference of 7.7%.
Per Capita Income Correlation Summary
| Measurement | Macedonian | Immigrants from Nepal |
| Minimum | $16,916 | $2,302 |
| Maximum | $93,662 | $72,138 |
| Range | $76,746 | $69,836 |
| Mean | $47,728 | $40,351 |
| Median | $46,977 | $40,773 |
| Interquartile 25% (IQ1) | $41,808 | $35,186 |
| Interquartile 75% (IQ3) | $52,108 | $46,005 |
| Interquartile Range (IQR) | $10,300 | $10,819 |
| Standard Deviation (Sample) | $13,530 | $10,460 |
| Standard Deviation (Population) | $13,431 | $10,388 |
Similar Demographics by Per Capita Income
Demographics Similar to Macedonians by Per Capita Income
In terms of per capita income, the demographic groups most similar to Macedonians are Italian ($47,574, a difference of 0.0%), Immigrants from Moldova ($47,489, a difference of 0.18%), Northern European ($47,698, a difference of 0.26%), Croatian ($47,742, a difference of 0.36%), and Immigrants from Zimbabwe ($47,394, a difference of 0.38%).
| Demographics | Rating | Rank | Per Capita Income |
| Immigrants | Ukraine | 99.3 /100 | #84 | Exceptional $48,134 |
| Austrians | 99.3 /100 | #85 | Exceptional $48,116 |
| Immigrants | Southern Europe | 99.3 /100 | #86 | Exceptional $48,027 |
| Ukrainians | 99.3 /100 | #87 | Exceptional $48,014 |
| Croatians | 99.0 /100 | #88 | Exceptional $47,742 |
| Northern Europeans | 98.9 /100 | #89 | Exceptional $47,698 |
| Italians | 98.8 /100 | #90 | Exceptional $47,574 |
| Macedonians | 98.8 /100 | #91 | Exceptional $47,573 |
| Immigrants | Moldova | 98.7 /100 | #92 | Exceptional $47,489 |
| Immigrants | Zimbabwe | 98.5 /100 | #93 | Exceptional $47,394 |
| Albanians | 98.5 /100 | #94 | Exceptional $47,379 |
| Immigrants | Egypt | 98.5 /100 | #95 | Exceptional $47,361 |
| Alsatians | 98.3 /100 | #96 | Exceptional $47,284 |
| Carpatho Rusyns | 98.2 /100 | #97 | Exceptional $47,248 |
| Immigrants | Pakistan | 97.9 /100 | #98 | Exceptional $47,084 |
Demographics Similar to Immigrants from Nepal by Per Capita Income
In terms of per capita income, the demographic groups most similar to Immigrants from Nepal are South American Indian ($44,206, a difference of 0.040%), Slovak ($44,229, a difference of 0.090%), South American ($44,114, a difference of 0.17%), Danish ($44,095, a difference of 0.21%), and Costa Rican ($44,090, a difference of 0.22%).
| Demographics | Rating | Rank | Per Capita Income |
| Norwegians | 71.5 /100 | #151 | Good $44,480 |
| Peruvians | 71.5 /100 | #152 | Good $44,479 |
| Scottish | 70.6 /100 | #153 | Good $44,440 |
| Portuguese | 68.7 /100 | #154 | Good $44,362 |
| Uruguayans | 67.6 /100 | #155 | Good $44,318 |
| Slovaks | 65.4 /100 | #156 | Good $44,229 |
| South American Indians | 64.8 /100 | #157 | Good $44,206 |
| Immigrants | Nepal | 64.3 /100 | #158 | Good $44,187 |
| South Americans | 62.4 /100 | #159 | Good $44,114 |
| Danes | 61.9 /100 | #160 | Good $44,095 |
| Costa Ricans | 61.8 /100 | #161 | Good $44,090 |
| Swiss | 61.4 /100 | #162 | Good $44,076 |
| Immigrants | South America | 61.2 /100 | #163 | Good $44,068 |
| Sri Lankans | 59.8 /100 | #164 | Average $44,014 |
| Immigrants | Philippines | 59.4 /100 | #165 | Average $44,000 |