Somali vs Immigrants from Belize Per Capita Income
COMPARE
Somali
Immigrants from Belize
Per Capita Income
Per Capita Income Comparison
Somalis
Immigrants from Belize
$40,367
PER CAPITA INCOME
2.4/ 100
METRIC RATING
238th/ 347
METRIC RANK
$38,614
PER CAPITA INCOME
0.3/ 100
METRIC RATING
270th/ 347
METRIC RANK
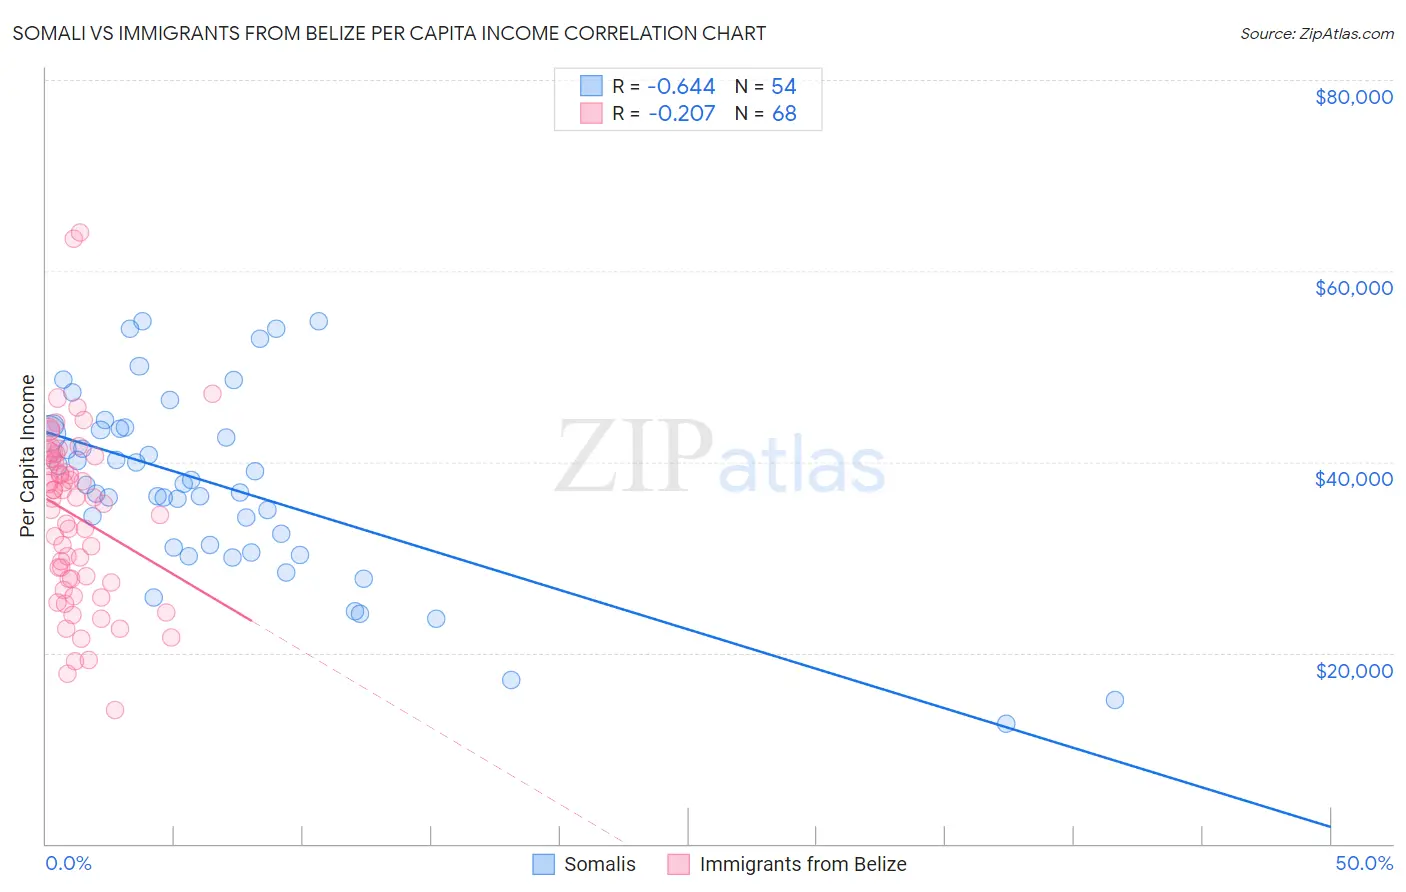
Somali vs Immigrants from Belize Per Capita Income Correlation Chart
The statistical analysis conducted on geographies consisting of 99,334,522 people shows a significant negative correlation between the proportion of Somalis and per capita income in the United States with a correlation coefficient (R) of -0.644 and weighted average of $40,367. Similarly, the statistical analysis conducted on geographies consisting of 130,314,146 people shows a weak negative correlation between the proportion of Immigrants from Belize and per capita income in the United States with a correlation coefficient (R) of -0.207 and weighted average of $38,614, a difference of 4.5%.
Per Capita Income Correlation Summary
| Measurement | Somali | Immigrants from Belize |
| Minimum | $12,576 | $13,974 |
| Maximum | $54,740 | $63,996 |
| Range | $42,164 | $50,022 |
| Mean | $37,481 | $34,271 |
| Median | $37,654 | $35,906 |
| Interquartile 25% (IQ1) | $31,050 | $27,515 |
| Interquartile 75% (IQ3) | $43,455 | $40,202 |
| Interquartile Range (IQR) | $12,404 | $12,687 |
| Standard Deviation (Sample) | $9,737 | $9,371 |
| Standard Deviation (Population) | $9,647 | $9,302 |
Similar Demographics by Per Capita Income
Demographics Similar to Somalis by Per Capita Income
In terms of per capita income, the demographic groups most similar to Somalis are Tsimshian ($40,344, a difference of 0.060%), Immigrants from Nigeria ($40,339, a difference of 0.070%), British West Indian ($40,330, a difference of 0.090%), Immigrants from Cambodia ($40,434, a difference of 0.16%), and Immigrants from Western Africa ($40,294, a difference of 0.18%).
| Demographics | Rating | Rank | Per Capita Income |
| Senegalese | 4.8 /100 | #231 | Tragic $41,000 |
| Guyanese | 4.5 /100 | #232 | Tragic $40,949 |
| Delaware | 3.8 /100 | #233 | Tragic $40,778 |
| Immigrants | West Indies | 3.7 /100 | #234 | Tragic $40,763 |
| Immigrants | Guyana | 3.6 /100 | #235 | Tragic $40,742 |
| Immigrants | Nonimmigrants | 3.4 /100 | #236 | Tragic $40,669 |
| Immigrants | Cambodia | 2.6 /100 | #237 | Tragic $40,434 |
| Somalis | 2.4 /100 | #238 | Tragic $40,367 |
| Tsimshian | 2.4 /100 | #239 | Tragic $40,344 |
| Immigrants | Nigeria | 2.3 /100 | #240 | Tragic $40,339 |
| British West Indians | 2.3 /100 | #241 | Tragic $40,330 |
| Immigrants | Western Africa | 2.2 /100 | #242 | Tragic $40,294 |
| German Russians | 2.2 /100 | #243 | Tragic $40,266 |
| French American Indians | 2.1 /100 | #244 | Tragic $40,244 |
| Sub-Saharan Africans | 1.9 /100 | #245 | Tragic $40,152 |
Demographics Similar to Immigrants from Belize by Per Capita Income
In terms of per capita income, the demographic groups most similar to Immigrants from Belize are Central American ($38,560, a difference of 0.14%), Immigrants from Cabo Verde ($38,540, a difference of 0.19%), Immigrants from Jamaica ($38,766, a difference of 0.39%), Liberian ($38,780, a difference of 0.43%), and Nepalese ($38,442, a difference of 0.45%).
| Demographics | Rating | Rank | Per Capita Income |
| Belizeans | 0.6 /100 | #263 | Tragic $39,097 |
| Americans | 0.6 /100 | #264 | Tragic $39,039 |
| Spanish Americans | 0.5 /100 | #265 | Tragic $39,012 |
| Salvadorans | 0.5 /100 | #266 | Tragic $38,858 |
| Immigrants | Zaire | 0.4 /100 | #267 | Tragic $38,848 |
| Liberians | 0.4 /100 | #268 | Tragic $38,780 |
| Immigrants | Jamaica | 0.4 /100 | #269 | Tragic $38,766 |
| Immigrants | Belize | 0.3 /100 | #270 | Tragic $38,614 |
| Central Americans | 0.3 /100 | #271 | Tragic $38,560 |
| Immigrants | Cabo Verde | 0.3 /100 | #272 | Tragic $38,540 |
| Nepalese | 0.3 /100 | #273 | Tragic $38,442 |
| Immigrants | El Salvador | 0.3 /100 | #274 | Tragic $38,394 |
| Immigrants | Liberia | 0.2 /100 | #275 | Tragic $38,165 |
| Hmong | 0.2 /100 | #276 | Tragic $38,120 |
| Comanche | 0.2 /100 | #277 | Tragic $38,088 |