Somali vs Inupiat Per Capita Income
COMPARE
Somali
Inupiat
Per Capita Income
Per Capita Income Comparison
Somalis
Inupiat
$40,367
PER CAPITA INCOME
2.4/ 100
METRIC RATING
238th/ 347
METRIC RANK
$36,999
PER CAPITA INCOME
0.1/ 100
METRIC RATING
305th/ 347
METRIC RANK
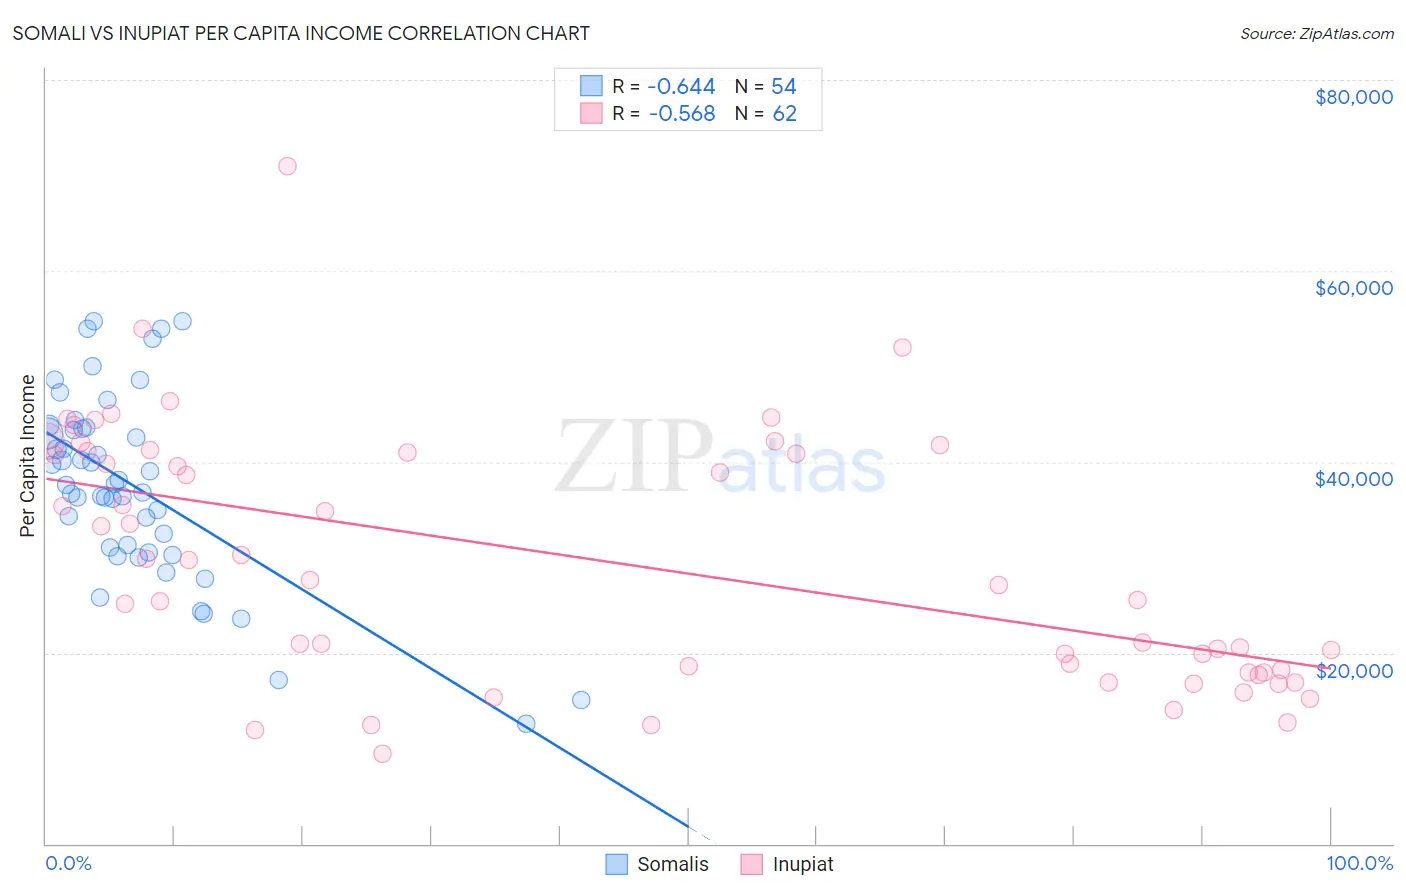
Somali vs Inupiat Per Capita Income Correlation Chart
The statistical analysis conducted on geographies consisting of 99,334,522 people shows a significant negative correlation between the proportion of Somalis and per capita income in the United States with a correlation coefficient (R) of -0.644 and weighted average of $40,367. Similarly, the statistical analysis conducted on geographies consisting of 96,349,338 people shows a substantial negative correlation between the proportion of Inupiat and per capita income in the United States with a correlation coefficient (R) of -0.568 and weighted average of $36,999, a difference of 9.1%.
Per Capita Income Correlation Summary
| Measurement | Somali | Inupiat |
| Minimum | $12,576 | $9,481 |
| Maximum | $54,740 | $71,025 |
| Range | $42,164 | $61,544 |
| Mean | $37,481 | $29,494 |
| Median | $37,654 | $27,374 |
| Interquartile 25% (IQ1) | $31,050 | $17,924 |
| Interquartile 75% (IQ3) | $43,455 | $40,952 |
| Interquartile Range (IQR) | $12,404 | $23,028 |
| Standard Deviation (Sample) | $9,737 | $13,151 |
| Standard Deviation (Population) | $9,647 | $13,045 |
Similar Demographics by Per Capita Income
Demographics Similar to Somalis by Per Capita Income
In terms of per capita income, the demographic groups most similar to Somalis are Tsimshian ($40,344, a difference of 0.060%), Immigrants from Nigeria ($40,339, a difference of 0.070%), British West Indian ($40,330, a difference of 0.090%), Immigrants from Cambodia ($40,434, a difference of 0.16%), and Immigrants from Western Africa ($40,294, a difference of 0.18%).
| Demographics | Rating | Rank | Per Capita Income |
| Senegalese | 4.8 /100 | #231 | Tragic $41,000 |
| Guyanese | 4.5 /100 | #232 | Tragic $40,949 |
| Delaware | 3.8 /100 | #233 | Tragic $40,778 |
| Immigrants | West Indies | 3.7 /100 | #234 | Tragic $40,763 |
| Immigrants | Guyana | 3.6 /100 | #235 | Tragic $40,742 |
| Immigrants | Nonimmigrants | 3.4 /100 | #236 | Tragic $40,669 |
| Immigrants | Cambodia | 2.6 /100 | #237 | Tragic $40,434 |
| Somalis | 2.4 /100 | #238 | Tragic $40,367 |
| Tsimshian | 2.4 /100 | #239 | Tragic $40,344 |
| Immigrants | Nigeria | 2.3 /100 | #240 | Tragic $40,339 |
| British West Indians | 2.3 /100 | #241 | Tragic $40,330 |
| Immigrants | Western Africa | 2.2 /100 | #242 | Tragic $40,294 |
| German Russians | 2.2 /100 | #243 | Tragic $40,266 |
| French American Indians | 2.1 /100 | #244 | Tragic $40,244 |
| Sub-Saharan Africans | 1.9 /100 | #245 | Tragic $40,152 |
Demographics Similar to Inupiat by Per Capita Income
In terms of per capita income, the demographic groups most similar to Inupiat are Honduran ($37,031, a difference of 0.080%), Paiute ($37,066, a difference of 0.18%), Shoshone ($37,072, a difference of 0.20%), Ottawa ($37,101, a difference of 0.28%), and Immigrants from Haiti ($36,849, a difference of 0.41%).
| Demographics | Rating | Rank | Per Capita Income |
| Immigrants | Caribbean | 0.1 /100 | #298 | Tragic $37,254 |
| Cherokee | 0.1 /100 | #299 | Tragic $37,203 |
| Immigrants | Bahamas | 0.1 /100 | #300 | Tragic $37,193 |
| Ottawa | 0.1 /100 | #301 | Tragic $37,101 |
| Shoshone | 0.1 /100 | #302 | Tragic $37,072 |
| Paiute | 0.1 /100 | #303 | Tragic $37,066 |
| Hondurans | 0.1 /100 | #304 | Tragic $37,031 |
| Inupiat | 0.1 /100 | #305 | Tragic $36,999 |
| Immigrants | Haiti | 0.0 /100 | #306 | Tragic $36,849 |
| Immigrants | Latin America | 0.0 /100 | #307 | Tragic $36,823 |
| Fijians | 0.0 /100 | #308 | Tragic $36,690 |
| Immigrants | Honduras | 0.0 /100 | #309 | Tragic $36,665 |
| Ute | 0.0 /100 | #310 | Tragic $36,651 |
| Chippewa | 0.0 /100 | #311 | Tragic $36,631 |
| Chickasaw | 0.0 /100 | #312 | Tragic $36,475 |