Slovene vs Immigrants from Haiti Median Family Income
COMPARE
Slovene
Immigrants from Haiti
Median Family Income
Median Family Income Comparison
Slovenes
Immigrants from Haiti
$106,020
MEDIAN FAMILY INCOME
84.7/ 100
METRIC RATING
142nd/ 347
METRIC RANK
$84,018
MEDIAN FAMILY INCOME
0.0/ 100
METRIC RATING
316th/ 347
METRIC RANK
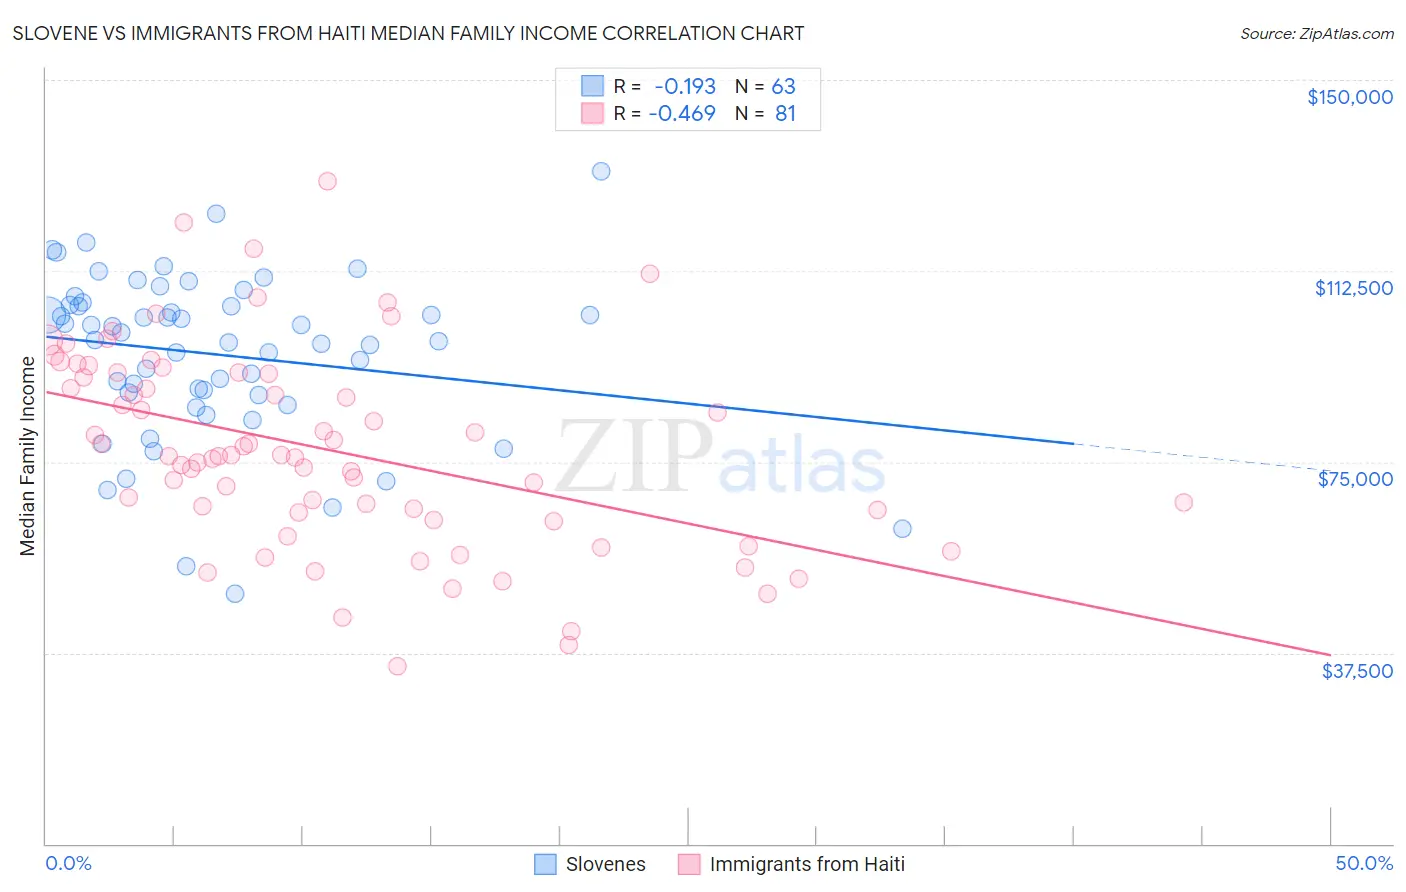
Slovene vs Immigrants from Haiti Median Family Income Correlation Chart
The statistical analysis conducted on geographies consisting of 261,214,906 people shows a poor negative correlation between the proportion of Slovenes and median family income in the United States with a correlation coefficient (R) of -0.193 and weighted average of $106,020. Similarly, the statistical analysis conducted on geographies consisting of 225,107,869 people shows a moderate negative correlation between the proportion of Immigrants from Haiti and median family income in the United States with a correlation coefficient (R) of -0.469 and weighted average of $84,018, a difference of 26.2%.
Median Family Income Correlation Summary
| Measurement | Slovene | Immigrants from Haiti |
| Minimum | $48,984 | $34,916 |
| Maximum | $132,096 | $130,212 |
| Range | $83,112 | $95,296 |
| Mean | $96,087 | $77,415 |
| Median | $98,910 | $76,203 |
| Interquartile 25% (IQ1) | $88,135 | $64,411 |
| Interquartile 75% (IQ3) | $105,910 | $92,467 |
| Interquartile Range (IQR) | $17,775 | $28,056 |
| Standard Deviation (Sample) | $16,283 | $19,581 |
| Standard Deviation (Population) | $16,153 | $19,460 |
Similar Demographics by Median Family Income
Demographics Similar to Slovenes by Median Family Income
In terms of median family income, the demographic groups most similar to Slovenes are Tongan ($105,967, a difference of 0.050%), Immigrants from Morocco ($105,964, a difference of 0.050%), Immigrants from Syria ($106,118, a difference of 0.090%), Danish ($105,900, a difference of 0.11%), and Norwegian ($106,144, a difference of 0.12%).
| Demographics | Rating | Rank | Median Family Income |
| Portuguese | 86.3 /100 | #135 | Excellent $106,286 |
| Immigrants | South Eastern Asia | 86.1 /100 | #136 | Excellent $106,252 |
| Immigrants | Uganda | 85.7 /100 | #137 | Excellent $106,188 |
| Immigrants | Vietnam | 85.7 /100 | #138 | Excellent $106,186 |
| Luxembourgers | 85.7 /100 | #139 | Excellent $106,183 |
| Norwegians | 85.5 /100 | #140 | Excellent $106,144 |
| Immigrants | Syria | 85.3 /100 | #141 | Excellent $106,118 |
| Slovenes | 84.7 /100 | #142 | Excellent $106,020 |
| Tongans | 84.3 /100 | #143 | Excellent $105,967 |
| Immigrants | Morocco | 84.3 /100 | #144 | Excellent $105,964 |
| Danes | 83.8 /100 | #145 | Excellent $105,900 |
| Czechs | 83.4 /100 | #146 | Excellent $105,839 |
| Immigrants | Chile | 82.1 /100 | #147 | Excellent $105,655 |
| Hungarians | 81.7 /100 | #148 | Excellent $105,609 |
| Immigrants | Germany | 80.9 /100 | #149 | Excellent $105,507 |
Demographics Similar to Immigrants from Haiti by Median Family Income
In terms of median family income, the demographic groups most similar to Immigrants from Haiti are Yakama ($83,932, a difference of 0.10%), Immigrants from Mexico ($83,639, a difference of 0.45%), Immigrants from Honduras ($83,618, a difference of 0.48%), Apache ($84,451, a difference of 0.52%), and Seminole ($83,354, a difference of 0.80%).
| Demographics | Rating | Rank | Median Family Income |
| Haitians | 0.0 /100 | #309 | Tragic $85,218 |
| Immigrants | Central America | 0.0 /100 | #310 | Tragic $85,050 |
| Hondurans | 0.0 /100 | #311 | Tragic $85,004 |
| Cubans | 0.0 /100 | #312 | Tragic $84,981 |
| Choctaw | 0.0 /100 | #313 | Tragic $84,835 |
| Immigrants | Bahamas | 0.0 /100 | #314 | Tragic $84,732 |
| Apache | 0.0 /100 | #315 | Tragic $84,451 |
| Immigrants | Haiti | 0.0 /100 | #316 | Tragic $84,018 |
| Yakama | 0.0 /100 | #317 | Tragic $83,932 |
| Immigrants | Mexico | 0.0 /100 | #318 | Tragic $83,639 |
| Immigrants | Honduras | 0.0 /100 | #319 | Tragic $83,618 |
| Seminole | 0.0 /100 | #320 | Tragic $83,354 |
| Immigrants | Caribbean | 0.0 /100 | #321 | Tragic $83,319 |
| Dominicans | 0.0 /100 | #322 | Tragic $82,888 |
| Bahamians | 0.0 /100 | #323 | Tragic $82,631 |