Seminole vs Immigrants from Ghana Median Female Earnings
COMPARE
Seminole
Immigrants from Ghana
Median Female Earnings
Median Female Earnings Comparison
Seminole
Immigrants from Ghana
$34,385
MEDIAN FEMALE EARNINGS
0.0/ 100
METRIC RATING
323rd/ 347
METRIC RANK
$39,894
MEDIAN FEMALE EARNINGS
60.0/ 100
METRIC RATING
166th/ 347
METRIC RANK
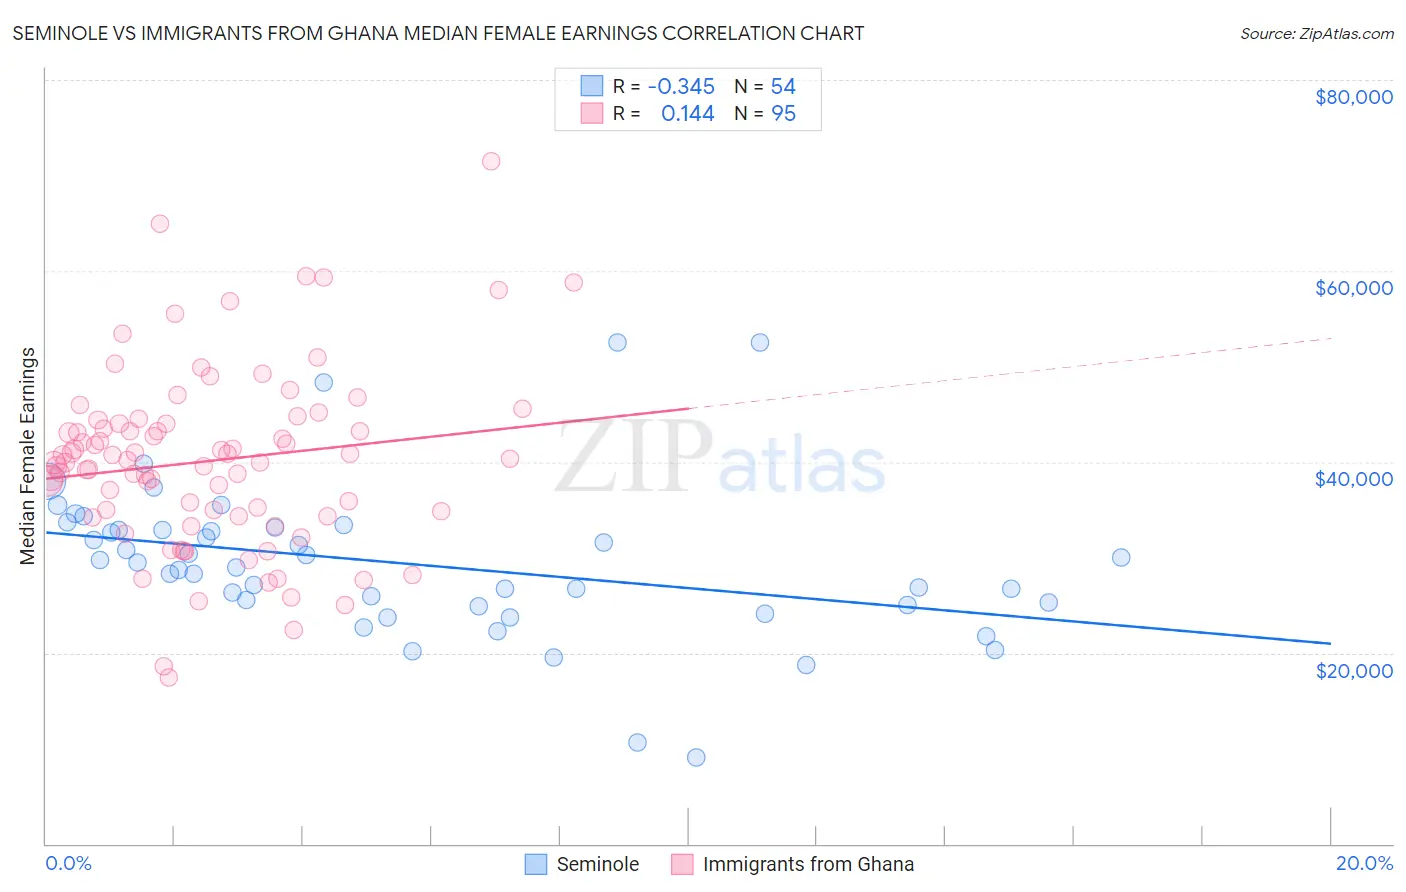
Seminole vs Immigrants from Ghana Median Female Earnings Correlation Chart
The statistical analysis conducted on geographies consisting of 118,266,998 people shows a mild negative correlation between the proportion of Seminole and median female earnings in the United States with a correlation coefficient (R) of -0.345 and weighted average of $34,385. Similarly, the statistical analysis conducted on geographies consisting of 199,948,896 people shows a poor positive correlation between the proportion of Immigrants from Ghana and median female earnings in the United States with a correlation coefficient (R) of 0.144 and weighted average of $39,894, a difference of 16.0%.
Median Female Earnings Correlation Summary
| Measurement | Seminole | Immigrants from Ghana |
| Minimum | $9,041 | $17,379 |
| Maximum | $52,528 | $71,536 |
| Range | $43,487 | $54,157 |
| Mean | $29,347 | $40,108 |
| Median | $29,210 | $40,246 |
| Interquartile 25% (IQ1) | $25,000 | $34,346 |
| Interquartile 75% (IQ3) | $32,861 | $44,036 |
| Interquartile Range (IQR) | $7,861 | $9,690 |
| Standard Deviation (Sample) | $8,052 | $9,436 |
| Standard Deviation (Population) | $7,977 | $9,386 |
Similar Demographics by Median Female Earnings
Demographics Similar to Seminole by Median Female Earnings
In terms of median female earnings, the demographic groups most similar to Seminole are Chickasaw ($34,414, a difference of 0.080%), Hispanic or Latino ($34,421, a difference of 0.11%), Immigrants from Congo ($34,317, a difference of 0.20%), Immigrants from Honduras ($34,647, a difference of 0.76%), and Dutch West Indian ($34,106, a difference of 0.82%).
| Demographics | Rating | Rank | Median Female Earnings |
| Cherokee | 0.0 /100 | #316 | Tragic $34,742 |
| Potawatomi | 0.0 /100 | #317 | Tragic $34,739 |
| Immigrants | Yemen | 0.0 /100 | #318 | Tragic $34,693 |
| Shoshone | 0.0 /100 | #319 | Tragic $34,677 |
| Immigrants | Honduras | 0.0 /100 | #320 | Tragic $34,647 |
| Hispanics or Latinos | 0.0 /100 | #321 | Tragic $34,421 |
| Chickasaw | 0.0 /100 | #322 | Tragic $34,414 |
| Seminole | 0.0 /100 | #323 | Tragic $34,385 |
| Immigrants | Congo | 0.0 /100 | #324 | Tragic $34,317 |
| Dutch West Indians | 0.0 /100 | #325 | Tragic $34,106 |
| Kiowa | 0.0 /100 | #326 | Tragic $34,074 |
| Cajuns | 0.0 /100 | #327 | Tragic $34,034 |
| Immigrants | Central America | 0.0 /100 | #328 | Tragic $33,953 |
| Hopi | 0.0 /100 | #329 | Tragic $33,932 |
| Menominee | 0.0 /100 | #330 | Tragic $33,894 |
Demographics Similar to Immigrants from Ghana by Median Female Earnings
In terms of median female earnings, the demographic groups most similar to Immigrants from Ghana are Luxembourger ($39,891, a difference of 0.010%), Immigrants from Bangladesh ($39,910, a difference of 0.040%), Immigrants from Peru ($39,871, a difference of 0.060%), Kenyan ($39,860, a difference of 0.080%), and Immigrants from Saudi Arabia ($39,952, a difference of 0.15%).
| Demographics | Rating | Rank | Median Female Earnings |
| Immigrants | Vietnam | 72.0 /100 | #159 | Good $40,153 |
| Inupiat | 68.9 /100 | #160 | Good $40,080 |
| Alsatians | 68.0 /100 | #161 | Good $40,060 |
| South American Indians | 66.1 /100 | #162 | Good $40,019 |
| Lebanese | 65.5 /100 | #163 | Good $40,006 |
| Immigrants | Saudi Arabia | 62.9 /100 | #164 | Good $39,952 |
| Immigrants | Bangladesh | 60.8 /100 | #165 | Good $39,910 |
| Immigrants | Ghana | 60.0 /100 | #166 | Good $39,894 |
| Luxembourgers | 59.9 /100 | #167 | Average $39,891 |
| Immigrants | Peru | 58.9 /100 | #168 | Average $39,871 |
| Kenyans | 58.4 /100 | #169 | Average $39,860 |
| Slovenes | 56.2 /100 | #170 | Average $39,817 |
| Immigrants | Portugal | 54.7 /100 | #171 | Average $39,788 |
| British | 53.8 /100 | #172 | Average $39,772 |
| Canadians | 51.4 /100 | #173 | Average $39,724 |