Seminole vs Immigrants from Austria Median Female Earnings
COMPARE
Seminole
Immigrants from Austria
Median Female Earnings
Median Female Earnings Comparison
Seminole
Immigrants from Austria
$34,385
MEDIAN FEMALE EARNINGS
0.0/ 100
METRIC RATING
323rd/ 347
METRIC RANK
$42,824
MEDIAN FEMALE EARNINGS
99.8/ 100
METRIC RATING
68th/ 347
METRIC RANK
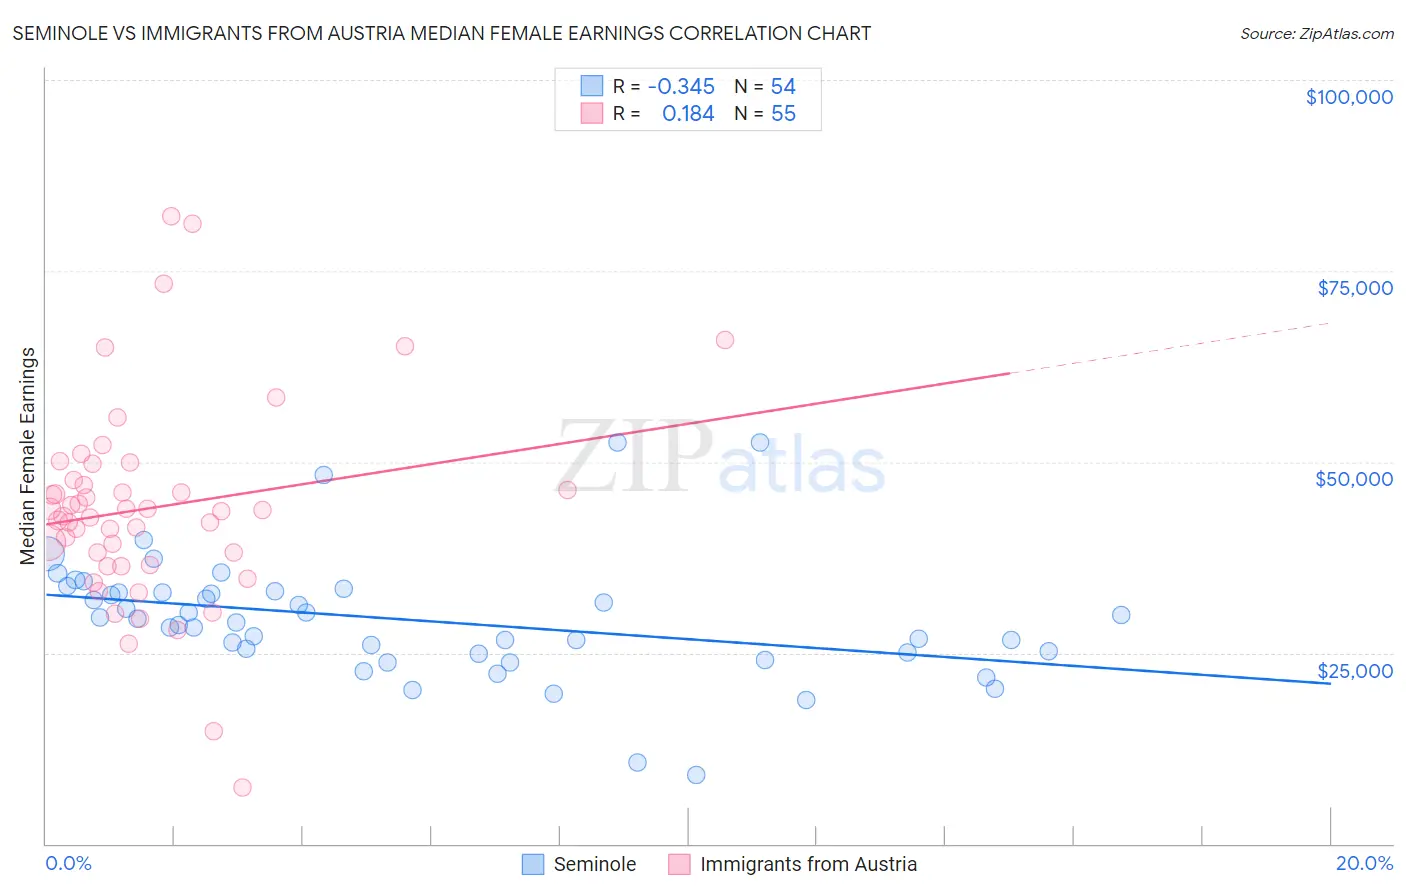
Seminole vs Immigrants from Austria Median Female Earnings Correlation Chart
The statistical analysis conducted on geographies consisting of 118,266,998 people shows a mild negative correlation between the proportion of Seminole and median female earnings in the United States with a correlation coefficient (R) of -0.345 and weighted average of $34,385. Similarly, the statistical analysis conducted on geographies consisting of 167,926,482 people shows a poor positive correlation between the proportion of Immigrants from Austria and median female earnings in the United States with a correlation coefficient (R) of 0.184 and weighted average of $42,824, a difference of 24.5%.
Median Female Earnings Correlation Summary
| Measurement | Seminole | Immigrants from Austria |
| Minimum | $9,041 | $7,363 |
| Maximum | $52,528 | $82,240 |
| Range | $43,487 | $74,877 |
| Mean | $29,347 | $43,980 |
| Median | $29,210 | $43,611 |
| Interquartile 25% (IQ1) | $25,000 | $36,503 |
| Interquartile 75% (IQ3) | $32,861 | $47,678 |
| Interquartile Range (IQR) | $7,861 | $11,175 |
| Standard Deviation (Sample) | $8,052 | $13,481 |
| Standard Deviation (Population) | $7,977 | $13,358 |
Similar Demographics by Median Female Earnings
Demographics Similar to Seminole by Median Female Earnings
In terms of median female earnings, the demographic groups most similar to Seminole are Chickasaw ($34,414, a difference of 0.080%), Hispanic or Latino ($34,421, a difference of 0.11%), Immigrants from Congo ($34,317, a difference of 0.20%), Immigrants from Honduras ($34,647, a difference of 0.76%), and Dutch West Indian ($34,106, a difference of 0.82%).
| Demographics | Rating | Rank | Median Female Earnings |
| Cherokee | 0.0 /100 | #316 | Tragic $34,742 |
| Potawatomi | 0.0 /100 | #317 | Tragic $34,739 |
| Immigrants | Yemen | 0.0 /100 | #318 | Tragic $34,693 |
| Shoshone | 0.0 /100 | #319 | Tragic $34,677 |
| Immigrants | Honduras | 0.0 /100 | #320 | Tragic $34,647 |
| Hispanics or Latinos | 0.0 /100 | #321 | Tragic $34,421 |
| Chickasaw | 0.0 /100 | #322 | Tragic $34,414 |
| Seminole | 0.0 /100 | #323 | Tragic $34,385 |
| Immigrants | Congo | 0.0 /100 | #324 | Tragic $34,317 |
| Dutch West Indians | 0.0 /100 | #325 | Tragic $34,106 |
| Kiowa | 0.0 /100 | #326 | Tragic $34,074 |
| Cajuns | 0.0 /100 | #327 | Tragic $34,034 |
| Immigrants | Central America | 0.0 /100 | #328 | Tragic $33,953 |
| Hopi | 0.0 /100 | #329 | Tragic $33,932 |
| Menominee | 0.0 /100 | #330 | Tragic $33,894 |
Demographics Similar to Immigrants from Austria by Median Female Earnings
In terms of median female earnings, the demographic groups most similar to Immigrants from Austria are Immigrants from Spain ($42,815, a difference of 0.020%), Immigrants from Norway ($42,837, a difference of 0.030%), Immigrants from Egypt ($42,837, a difference of 0.030%), Sierra Leonean ($42,868, a difference of 0.10%), and Immigrants from Ethiopia ($42,744, a difference of 0.19%).
| Demographics | Rating | Rank | Median Female Earnings |
| Immigrants | Bulgaria | 99.9 /100 | #61 | Exceptional $43,085 |
| Afghans | 99.9 /100 | #62 | Exceptional $43,077 |
| Immigrants | Ukraine | 99.9 /100 | #63 | Exceptional $43,069 |
| Immigrants | Pakistan | 99.9 /100 | #64 | Exceptional $43,052 |
| Sierra Leoneans | 99.9 /100 | #65 | Exceptional $42,868 |
| Immigrants | Norway | 99.9 /100 | #66 | Exceptional $42,837 |
| Immigrants | Egypt | 99.9 /100 | #67 | Exceptional $42,837 |
| Immigrants | Austria | 99.8 /100 | #68 | Exceptional $42,824 |
| Immigrants | Spain | 99.8 /100 | #69 | Exceptional $42,815 |
| Immigrants | Ethiopia | 99.8 /100 | #70 | Exceptional $42,744 |
| Immigrants | Romania | 99.8 /100 | #71 | Exceptional $42,718 |
| Albanians | 99.8 /100 | #72 | Exceptional $42,584 |
| Mongolians | 99.7 /100 | #73 | Exceptional $42,542 |
| Immigrants | South Africa | 99.7 /100 | #74 | Exceptional $42,508 |
| New Zealanders | 99.7 /100 | #75 | Exceptional $42,446 |