Swedish vs Immigrants from Ghana Median Female Earnings
COMPARE
Swedish
Immigrants from Ghana
Median Female Earnings
Median Female Earnings Comparison
Swedes
Immigrants from Ghana
$39,421
MEDIAN FEMALE EARNINGS
36.0/ 100
METRIC RATING
187th/ 347
METRIC RANK
$39,894
MEDIAN FEMALE EARNINGS
60.0/ 100
METRIC RATING
166th/ 347
METRIC RANK
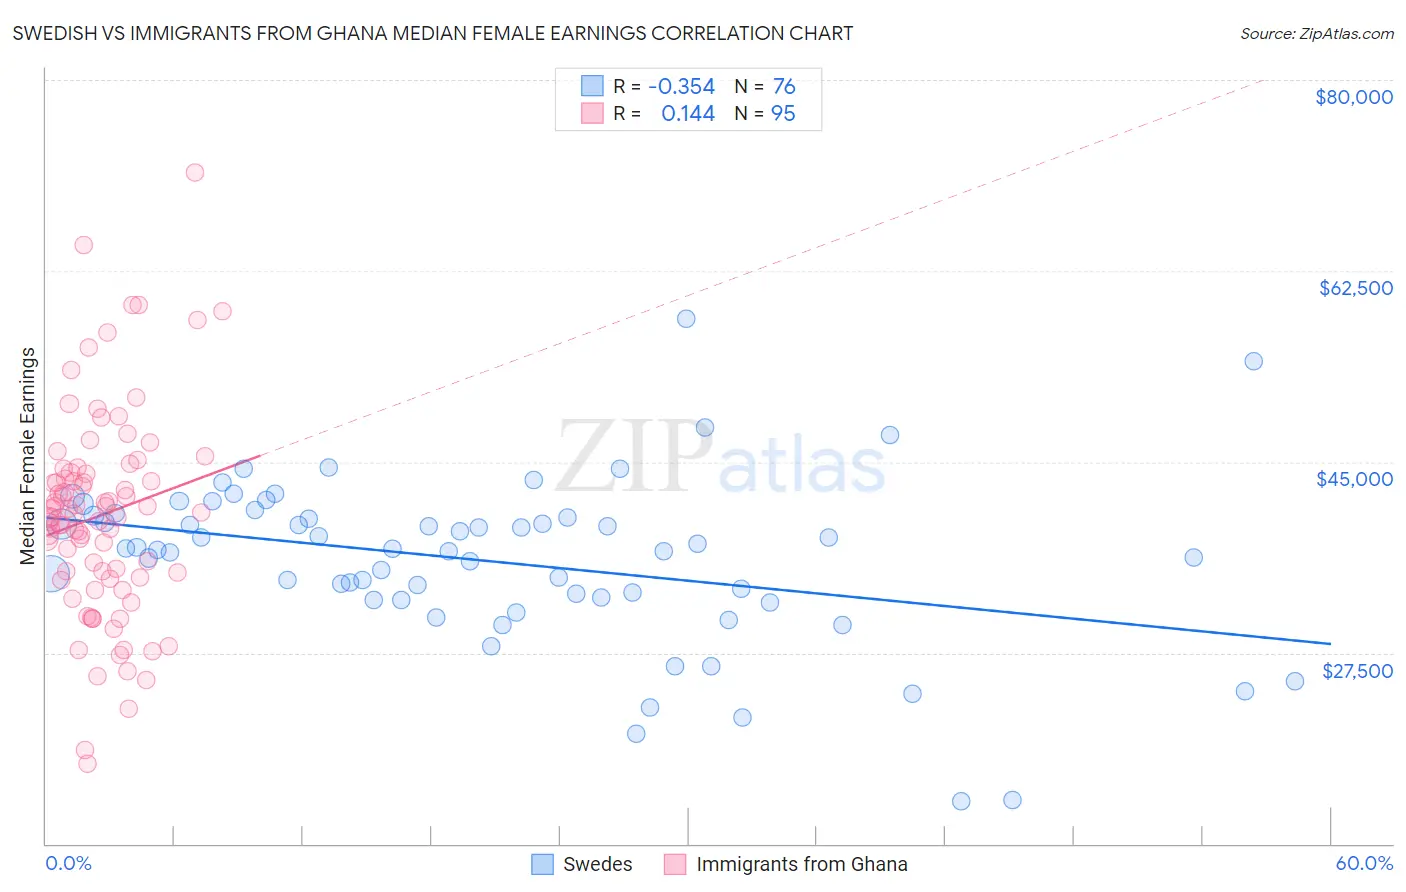
Swedish vs Immigrants from Ghana Median Female Earnings Correlation Chart
The statistical analysis conducted on geographies consisting of 538,112,894 people shows a mild negative correlation between the proportion of Swedes and median female earnings in the United States with a correlation coefficient (R) of -0.354 and weighted average of $39,421. Similarly, the statistical analysis conducted on geographies consisting of 199,948,896 people shows a poor positive correlation between the proportion of Immigrants from Ghana and median female earnings in the United States with a correlation coefficient (R) of 0.144 and weighted average of $39,894, a difference of 1.2%.
Median Female Earnings Correlation Summary
| Measurement | Swedish | Immigrants from Ghana |
| Minimum | $13,839 | $17,379 |
| Maximum | $58,087 | $71,536 |
| Range | $44,248 | $54,157 |
| Mean | $35,925 | $40,108 |
| Median | $36,993 | $40,246 |
| Interquartile 25% (IQ1) | $32,470 | $34,346 |
| Interquartile 75% (IQ3) | $39,982 | $44,036 |
| Interquartile Range (IQR) | $7,512 | $9,690 |
| Standard Deviation (Sample) | $7,648 | $9,436 |
| Standard Deviation (Population) | $7,597 | $9,386 |
Similar Demographics by Median Female Earnings
Demographics Similar to Swedes by Median Female Earnings
In terms of median female earnings, the demographic groups most similar to Swedes are Bermudan ($39,418, a difference of 0.010%), Immigrants from West Indies ($39,441, a difference of 0.050%), Colombian ($39,439, a difference of 0.050%), European ($39,457, a difference of 0.090%), and Senegalese ($39,384, a difference of 0.090%).
| Demographics | Rating | Rank | Median Female Earnings |
| Immigrants | Kenya | 41.6 /100 | #180 | Average $39,535 |
| Tsimshian | 41.4 /100 | #181 | Average $39,530 |
| Tlingit-Haida | 40.5 /100 | #182 | Average $39,513 |
| Hungarians | 40.3 /100 | #183 | Average $39,510 |
| Europeans | 37.7 /100 | #184 | Fair $39,457 |
| Immigrants | West Indies | 36.9 /100 | #185 | Fair $39,441 |
| Colombians | 36.9 /100 | #186 | Fair $39,439 |
| Swedes | 36.0 /100 | #187 | Fair $39,421 |
| Bermudans | 35.9 /100 | #188 | Fair $39,418 |
| Senegalese | 34.2 /100 | #189 | Fair $39,384 |
| Puget Sound Salish | 33.9 /100 | #190 | Fair $39,376 |
| Immigrants | Western Africa | 32.7 /100 | #191 | Fair $39,351 |
| Immigrants | Immigrants | 31.7 /100 | #192 | Fair $39,328 |
| Immigrants | Nigeria | 30.2 /100 | #193 | Fair $39,294 |
| Irish | 30.0 /100 | #194 | Fair $39,291 |
Demographics Similar to Immigrants from Ghana by Median Female Earnings
In terms of median female earnings, the demographic groups most similar to Immigrants from Ghana are Luxembourger ($39,891, a difference of 0.010%), Immigrants from Bangladesh ($39,910, a difference of 0.040%), Immigrants from Peru ($39,871, a difference of 0.060%), Kenyan ($39,860, a difference of 0.080%), and Immigrants from Saudi Arabia ($39,952, a difference of 0.15%).
| Demographics | Rating | Rank | Median Female Earnings |
| Immigrants | Vietnam | 72.0 /100 | #159 | Good $40,153 |
| Inupiat | 68.9 /100 | #160 | Good $40,080 |
| Alsatians | 68.0 /100 | #161 | Good $40,060 |
| South American Indians | 66.1 /100 | #162 | Good $40,019 |
| Lebanese | 65.5 /100 | #163 | Good $40,006 |
| Immigrants | Saudi Arabia | 62.9 /100 | #164 | Good $39,952 |
| Immigrants | Bangladesh | 60.8 /100 | #165 | Good $39,910 |
| Immigrants | Ghana | 60.0 /100 | #166 | Good $39,894 |
| Luxembourgers | 59.9 /100 | #167 | Average $39,891 |
| Immigrants | Peru | 58.9 /100 | #168 | Average $39,871 |
| Kenyans | 58.4 /100 | #169 | Average $39,860 |
| Slovenes | 56.2 /100 | #170 | Average $39,817 |
| Immigrants | Portugal | 54.7 /100 | #171 | Average $39,788 |
| British | 53.8 /100 | #172 | Average $39,772 |
| Canadians | 51.4 /100 | #173 | Average $39,724 |