Seminole vs Danish Median Female Earnings
COMPARE
Seminole
Danish
Median Female Earnings
Median Female Earnings Comparison
Seminole
Danes
$34,385
MEDIAN FEMALE EARNINGS
0.0/ 100
METRIC RATING
323rd/ 347
METRIC RANK
$37,730
MEDIAN FEMALE EARNINGS
1.6/ 100
METRIC RATING
253rd/ 347
METRIC RANK
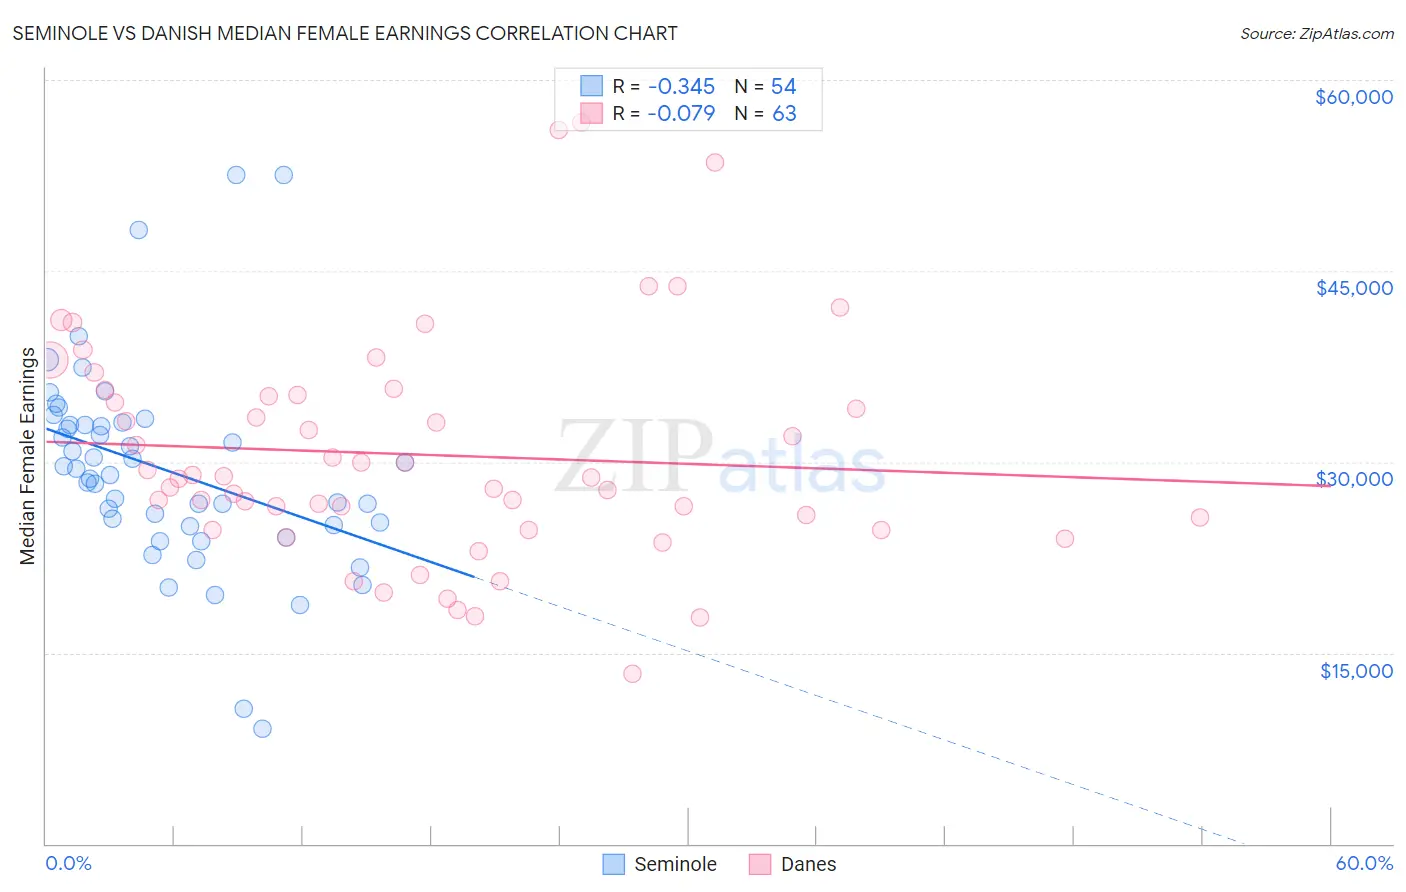
Seminole vs Danish Median Female Earnings Correlation Chart
The statistical analysis conducted on geographies consisting of 118,266,998 people shows a mild negative correlation between the proportion of Seminole and median female earnings in the United States with a correlation coefficient (R) of -0.345 and weighted average of $34,385. Similarly, the statistical analysis conducted on geographies consisting of 473,573,147 people shows a slight negative correlation between the proportion of Danes and median female earnings in the United States with a correlation coefficient (R) of -0.079 and weighted average of $37,730, a difference of 9.7%.
Median Female Earnings Correlation Summary
| Measurement | Seminole | Danish |
| Minimum | $9,041 | $13,388 |
| Maximum | $52,528 | $56,667 |
| Range | $43,487 | $43,279 |
| Mean | $29,347 | $30,568 |
| Median | $29,210 | $28,750 |
| Interquartile 25% (IQ1) | $25,000 | $24,607 |
| Interquartile 75% (IQ3) | $32,861 | $35,286 |
| Interquartile Range (IQR) | $7,861 | $10,679 |
| Standard Deviation (Sample) | $8,052 | $8,841 |
| Standard Deviation (Population) | $7,977 | $8,771 |
Similar Demographics by Median Female Earnings
Demographics Similar to Seminole by Median Female Earnings
In terms of median female earnings, the demographic groups most similar to Seminole are Chickasaw ($34,414, a difference of 0.080%), Hispanic or Latino ($34,421, a difference of 0.11%), Immigrants from Congo ($34,317, a difference of 0.20%), Immigrants from Honduras ($34,647, a difference of 0.76%), and Dutch West Indian ($34,106, a difference of 0.82%).
| Demographics | Rating | Rank | Median Female Earnings |
| Cherokee | 0.0 /100 | #316 | Tragic $34,742 |
| Potawatomi | 0.0 /100 | #317 | Tragic $34,739 |
| Immigrants | Yemen | 0.0 /100 | #318 | Tragic $34,693 |
| Shoshone | 0.0 /100 | #319 | Tragic $34,677 |
| Immigrants | Honduras | 0.0 /100 | #320 | Tragic $34,647 |
| Hispanics or Latinos | 0.0 /100 | #321 | Tragic $34,421 |
| Chickasaw | 0.0 /100 | #322 | Tragic $34,414 |
| Seminole | 0.0 /100 | #323 | Tragic $34,385 |
| Immigrants | Congo | 0.0 /100 | #324 | Tragic $34,317 |
| Dutch West Indians | 0.0 /100 | #325 | Tragic $34,106 |
| Kiowa | 0.0 /100 | #326 | Tragic $34,074 |
| Cajuns | 0.0 /100 | #327 | Tragic $34,034 |
| Immigrants | Central America | 0.0 /100 | #328 | Tragic $33,953 |
| Hopi | 0.0 /100 | #329 | Tragic $33,932 |
| Menominee | 0.0 /100 | #330 | Tragic $33,894 |
Demographics Similar to Danes by Median Female Earnings
In terms of median female earnings, the demographic groups most similar to Danes are Immigrants from Dominica ($37,825, a difference of 0.25%), Welsh ($37,856, a difference of 0.33%), Immigrants from Iraq ($37,864, a difference of 0.35%), Alaskan Athabascan ($37,905, a difference of 0.46%), and Swiss ($37,904, a difference of 0.46%).
| Demographics | Rating | Rank | Median Female Earnings |
| Delaware | 2.6 /100 | #246 | Tragic $37,964 |
| Immigrants | Somalia | 2.4 /100 | #247 | Tragic $37,914 |
| Alaskan Athabascans | 2.3 /100 | #248 | Tragic $37,905 |
| Swiss | 2.3 /100 | #249 | Tragic $37,904 |
| Immigrants | Iraq | 2.2 /100 | #250 | Tragic $37,864 |
| Welsh | 2.1 /100 | #251 | Tragic $37,856 |
| Immigrants | Dominica | 2.0 /100 | #252 | Tragic $37,825 |
| Danes | 1.6 /100 | #253 | Tragic $37,730 |
| Whites/Caucasians | 1.1 /100 | #254 | Tragic $37,531 |
| Colville | 1.1 /100 | #255 | Tragic $37,514 |
| Samoans | 1.0 /100 | #256 | Tragic $37,498 |
| Hawaiians | 1.0 /100 | #257 | Tragic $37,497 |
| Belizeans | 0.9 /100 | #258 | Tragic $37,429 |
| Scotch-Irish | 0.8 /100 | #259 | Tragic $37,383 |
| Dutch | 0.7 /100 | #260 | Tragic $37,339 |