Scotch-Irish vs Ethiopian Householder Income Under 25 years
COMPARE
Scotch-Irish
Ethiopian
Householder Income Under 25 years
Householder Income Under 25 years Comparison
Scotch-Irish
Ethiopians
$49,039
HOUSEHOLDER INCOME UNDER 25 YEARS
0.0/ 100
METRIC RATING
285th/ 347
METRIC RANK
$53,818
HOUSEHOLDER INCOME UNDER 25 YEARS
98.2/ 100
METRIC RATING
104th/ 347
METRIC RANK
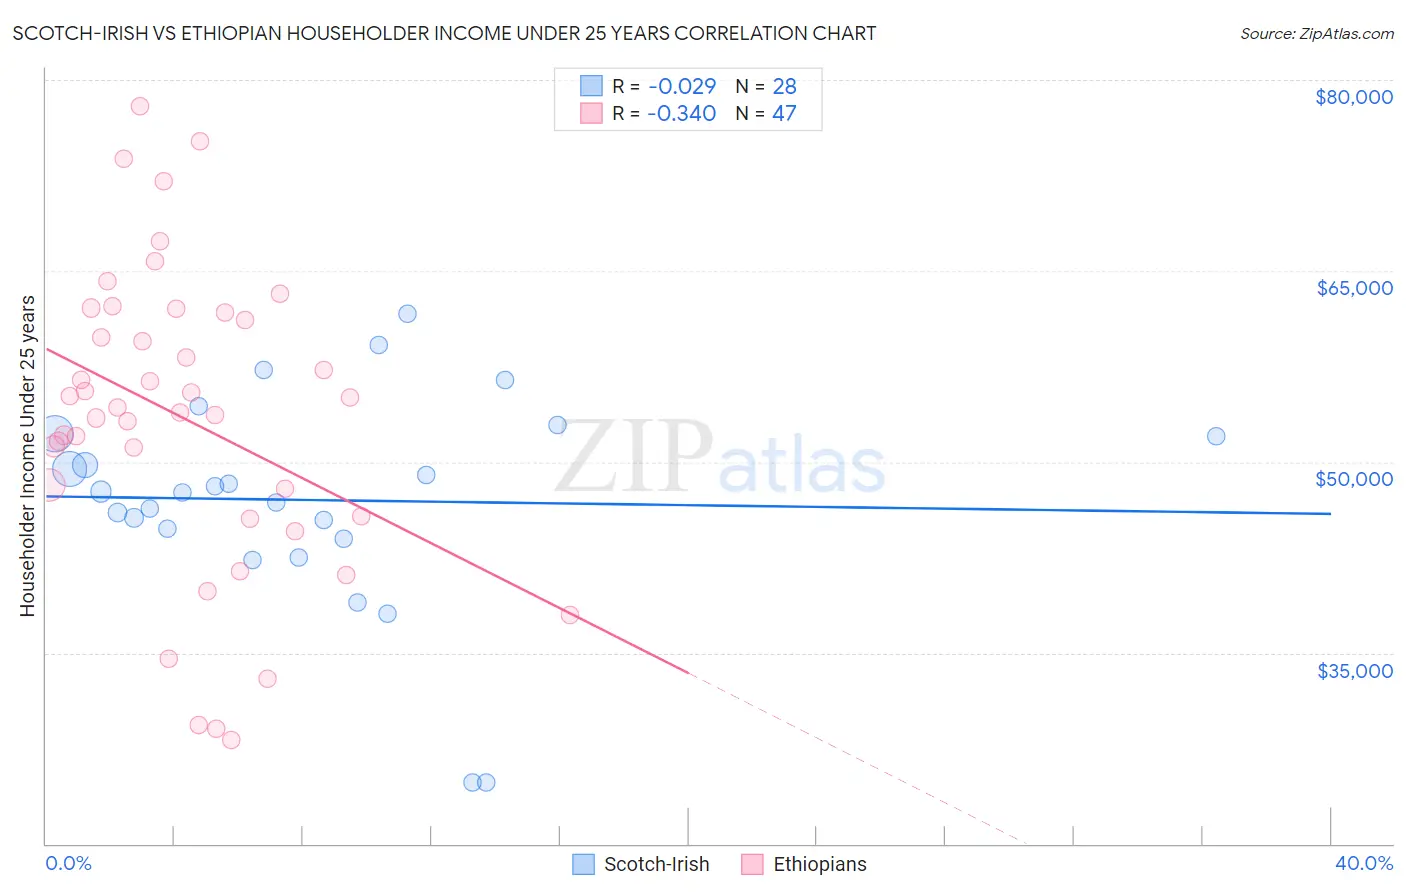
Scotch-Irish vs Ethiopian Householder Income Under 25 years Correlation Chart
The statistical analysis conducted on geographies consisting of 427,674,236 people shows no correlation between the proportion of Scotch-Irish and household income with householder under the age of 25 in the United States with a correlation coefficient (R) of -0.029 and weighted average of $49,039. Similarly, the statistical analysis conducted on geographies consisting of 201,530,773 people shows a mild negative correlation between the proportion of Ethiopians and household income with householder under the age of 25 in the United States with a correlation coefficient (R) of -0.340 and weighted average of $53,818, a difference of 9.8%.
Householder Income Under 25 years Correlation Summary
| Measurement | Scotch-Irish | Ethiopian |
| Minimum | $24,821 | $28,125 |
| Maximum | $61,601 | $77,898 |
| Range | $36,780 | $49,773 |
| Mean | $47,004 | $53,404 |
| Median | $47,645 | $54,292 |
| Interquartile 25% (IQ1) | $44,331 | $45,695 |
| Interquartile 75% (IQ3) | $52,103 | $61,784 |
| Interquartile Range (IQR) | $7,772 | $16,089 |
| Standard Deviation (Sample) | $8,411 | $11,871 |
| Standard Deviation (Population) | $8,259 | $11,744 |
Similar Demographics by Householder Income Under 25 years
Demographics Similar to Scotch-Irish by Householder Income Under 25 years
In terms of householder income under 25 years, the demographic groups most similar to Scotch-Irish are French American Indian ($48,977, a difference of 0.13%), Carpatho Rusyn ($49,113, a difference of 0.15%), Senegalese ($48,953, a difference of 0.18%), Liberian ($48,917, a difference of 0.25%), and Immigrants from Nigeria ($49,174, a difference of 0.28%).
| Demographics | Rating | Rank | Householder Income Under 25 years |
| Nigerians | 0.1 /100 | #278 | Tragic $49,416 |
| Apache | 0.1 /100 | #279 | Tragic $49,395 |
| Hmong | 0.1 /100 | #280 | Tragic $49,364 |
| Immigrants | Nonimmigrants | 0.1 /100 | #281 | Tragic $49,348 |
| Alsatians | 0.1 /100 | #282 | Tragic $49,267 |
| Immigrants | Nigeria | 0.1 /100 | #283 | Tragic $49,174 |
| Carpatho Rusyns | 0.1 /100 | #284 | Tragic $49,113 |
| Scotch-Irish | 0.0 /100 | #285 | Tragic $49,039 |
| French American Indians | 0.0 /100 | #286 | Tragic $48,977 |
| Senegalese | 0.0 /100 | #287 | Tragic $48,953 |
| Liberians | 0.0 /100 | #288 | Tragic $48,917 |
| Hondurans | 0.0 /100 | #289 | Tragic $48,885 |
| Americans | 0.0 /100 | #290 | Tragic $48,860 |
| Immigrants | Burma/Myanmar | 0.0 /100 | #291 | Tragic $48,749 |
| Shoshone | 0.0 /100 | #292 | Tragic $48,720 |
Demographics Similar to Ethiopians by Householder Income Under 25 years
In terms of householder income under 25 years, the demographic groups most similar to Ethiopians are Immigrants from France ($53,805, a difference of 0.020%), Ukrainian ($53,843, a difference of 0.050%), Albanian ($53,794, a difference of 0.050%), Australian ($53,739, a difference of 0.15%), and Maltese ($53,735, a difference of 0.15%).
| Demographics | Rating | Rank | Householder Income Under 25 years |
| Immigrants | Portugal | 99.1 /100 | #97 | Exceptional $54,105 |
| Eastern Europeans | 99.0 /100 | #98 | Exceptional $54,066 |
| Alaska Natives | 98.8 /100 | #99 | Exceptional $54,000 |
| Immigrants | Kazakhstan | 98.8 /100 | #100 | Exceptional $53,990 |
| South Americans | 98.6 /100 | #101 | Exceptional $53,939 |
| Ecuadorians | 98.5 /100 | #102 | Exceptional $53,911 |
| Ukrainians | 98.3 /100 | #103 | Exceptional $53,843 |
| Ethiopians | 98.2 /100 | #104 | Exceptional $53,818 |
| Immigrants | France | 98.1 /100 | #105 | Exceptional $53,805 |
| Albanians | 98.1 /100 | #106 | Exceptional $53,794 |
| Australians | 97.8 /100 | #107 | Exceptional $53,739 |
| Maltese | 97.8 /100 | #108 | Exceptional $53,735 |
| Immigrants | Ecuador | 97.7 /100 | #109 | Exceptional $53,722 |
| Greeks | 97.7 /100 | #110 | Exceptional $53,715 |
| Immigrants | Colombia | 97.7 /100 | #111 | Exceptional $53,714 |