Scotch-Irish vs Fijian Householder Income Under 25 years
COMPARE
Scotch-Irish
Fijian
Householder Income Under 25 years
Householder Income Under 25 years Comparison
Scotch-Irish
Fijians
$49,039
HOUSEHOLDER INCOME UNDER 25 YEARS
0.0/ 100
METRIC RATING
285th/ 347
METRIC RANK
$50,132
HOUSEHOLDER INCOME UNDER 25 YEARS
0.6/ 100
METRIC RATING
264th/ 347
METRIC RANK
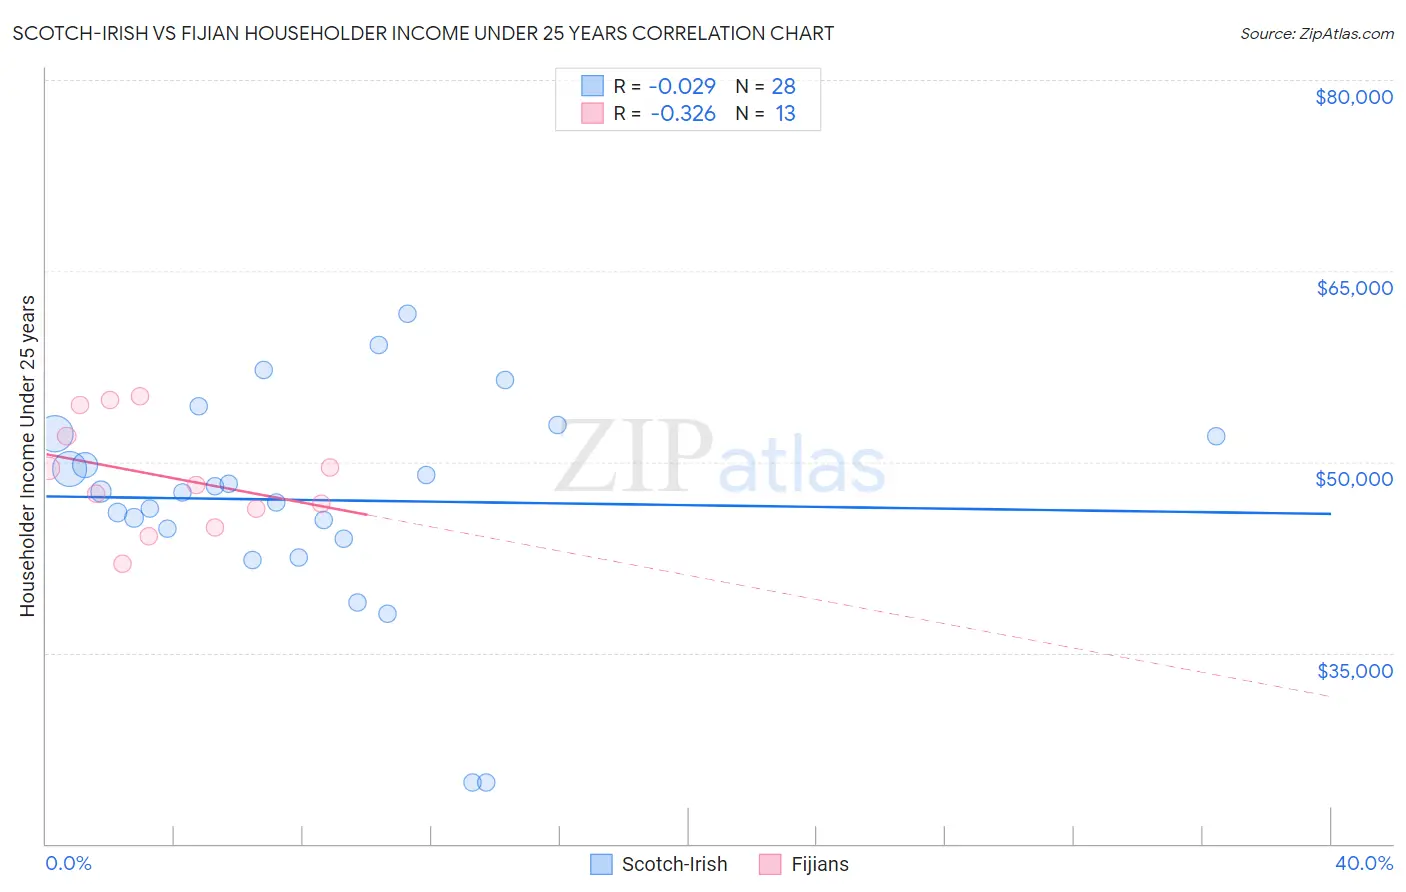
Scotch-Irish vs Fijian Householder Income Under 25 years Correlation Chart
The statistical analysis conducted on geographies consisting of 427,674,236 people shows no correlation between the proportion of Scotch-Irish and household income with householder under the age of 25 in the United States with a correlation coefficient (R) of -0.029 and weighted average of $49,039. Similarly, the statistical analysis conducted on geographies consisting of 53,807,935 people shows a mild negative correlation between the proportion of Fijians and household income with householder under the age of 25 in the United States with a correlation coefficient (R) of -0.326 and weighted average of $50,132, a difference of 2.2%.
Householder Income Under 25 years Correlation Summary
| Measurement | Scotch-Irish | Fijian |
| Minimum | $24,821 | $42,002 |
| Maximum | $61,601 | $55,154 |
| Range | $36,780 | $13,151 |
| Mean | $47,004 | $48,862 |
| Median | $47,645 | $48,154 |
| Interquartile 25% (IQ1) | $44,331 | $45,561 |
| Interquartile 75% (IQ3) | $52,103 | $53,230 |
| Interquartile Range (IQR) | $7,772 | $7,669 |
| Standard Deviation (Sample) | $8,411 | $4,254 |
| Standard Deviation (Population) | $8,259 | $4,087 |
Similar Demographics by Householder Income Under 25 years
Demographics Similar to Scotch-Irish by Householder Income Under 25 years
In terms of householder income under 25 years, the demographic groups most similar to Scotch-Irish are French American Indian ($48,977, a difference of 0.13%), Carpatho Rusyn ($49,113, a difference of 0.15%), Senegalese ($48,953, a difference of 0.18%), Liberian ($48,917, a difference of 0.25%), and Immigrants from Nigeria ($49,174, a difference of 0.28%).
| Demographics | Rating | Rank | Householder Income Under 25 years |
| Nigerians | 0.1 /100 | #278 | Tragic $49,416 |
| Apache | 0.1 /100 | #279 | Tragic $49,395 |
| Hmong | 0.1 /100 | #280 | Tragic $49,364 |
| Immigrants | Nonimmigrants | 0.1 /100 | #281 | Tragic $49,348 |
| Alsatians | 0.1 /100 | #282 | Tragic $49,267 |
| Immigrants | Nigeria | 0.1 /100 | #283 | Tragic $49,174 |
| Carpatho Rusyns | 0.1 /100 | #284 | Tragic $49,113 |
| Scotch-Irish | 0.0 /100 | #285 | Tragic $49,039 |
| French American Indians | 0.0 /100 | #286 | Tragic $48,977 |
| Senegalese | 0.0 /100 | #287 | Tragic $48,953 |
| Liberians | 0.0 /100 | #288 | Tragic $48,917 |
| Hondurans | 0.0 /100 | #289 | Tragic $48,885 |
| Americans | 0.0 /100 | #290 | Tragic $48,860 |
| Immigrants | Burma/Myanmar | 0.0 /100 | #291 | Tragic $48,749 |
| Shoshone | 0.0 /100 | #292 | Tragic $48,720 |
Demographics Similar to Fijians by Householder Income Under 25 years
In terms of householder income under 25 years, the demographic groups most similar to Fijians are Belgian ($50,113, a difference of 0.040%), Immigrants from Venezuela ($50,109, a difference of 0.050%), Immigrants from Dominican Republic ($50,204, a difference of 0.14%), Immigrants from Laos ($50,041, a difference of 0.18%), and Haitian ($50,231, a difference of 0.20%).
| Demographics | Rating | Rank | Householder Income Under 25 years |
| Lebanese | 1.1 /100 | #257 | Tragic $50,355 |
| Whites/Caucasians | 1.1 /100 | #258 | Tragic $50,336 |
| Immigrants | Dominica | 1.0 /100 | #259 | Tragic $50,301 |
| Hispanics or Latinos | 0.9 /100 | #260 | Tragic $50,279 |
| Hungarians | 0.9 /100 | #261 | Tragic $50,247 |
| Haitians | 0.8 /100 | #262 | Tragic $50,231 |
| Immigrants | Dominican Republic | 0.8 /100 | #263 | Tragic $50,204 |
| Fijians | 0.6 /100 | #264 | Tragic $50,132 |
| Belgians | 0.6 /100 | #265 | Tragic $50,113 |
| Immigrants | Venezuela | 0.6 /100 | #266 | Tragic $50,109 |
| Immigrants | Laos | 0.5 /100 | #267 | Tragic $50,041 |
| Venezuelans | 0.5 /100 | #268 | Tragic $50,011 |
| Ute | 0.5 /100 | #269 | Tragic $49,997 |
| Mexicans | 0.5 /100 | #270 | Tragic $49,989 |
| Taiwanese | 0.3 /100 | #271 | Tragic $49,804 |