Immigrants from Eastern Africa vs Ethiopian Householder Income Under 25 years
COMPARE
Immigrants from Eastern Africa
Ethiopian
Householder Income Under 25 years
Householder Income Under 25 years Comparison
Immigrants from Eastern Africa
Ethiopians
$51,158
HOUSEHOLDER INCOME UNDER 25 YEARS
7.4/ 100
METRIC RATING
221st/ 347
METRIC RANK
$53,818
HOUSEHOLDER INCOME UNDER 25 YEARS
98.2/ 100
METRIC RATING
104th/ 347
METRIC RANK
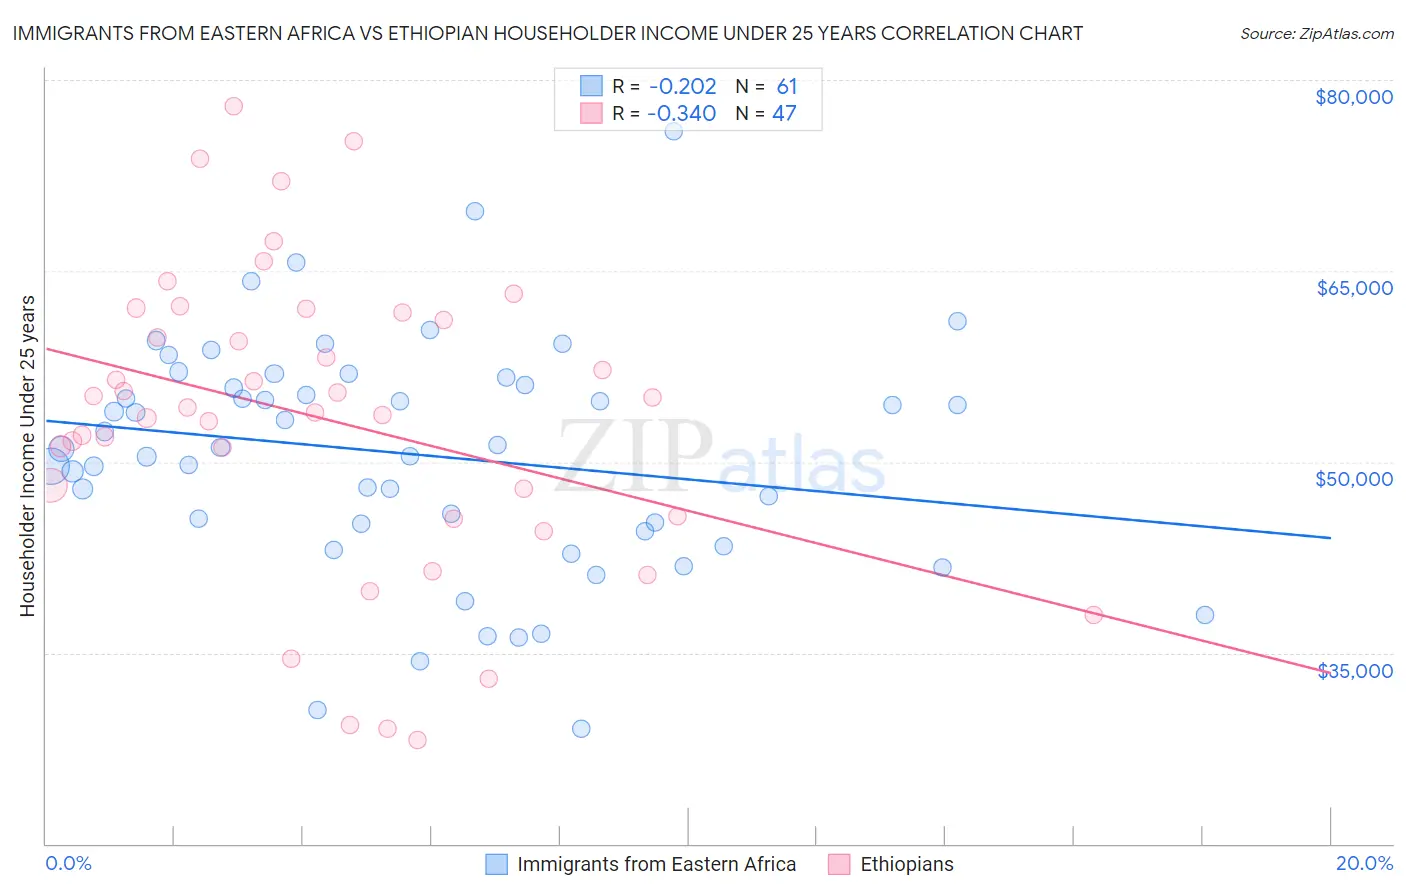
Immigrants from Eastern Africa vs Ethiopian Householder Income Under 25 years Correlation Chart
The statistical analysis conducted on geographies consisting of 307,584,270 people shows a weak negative correlation between the proportion of Immigrants from Eastern Africa and household income with householder under the age of 25 in the United States with a correlation coefficient (R) of -0.202 and weighted average of $51,158. Similarly, the statistical analysis conducted on geographies consisting of 201,530,773 people shows a mild negative correlation between the proportion of Ethiopians and household income with householder under the age of 25 in the United States with a correlation coefficient (R) of -0.340 and weighted average of $53,818, a difference of 5.2%.
Householder Income Under 25 years Correlation Summary
| Measurement | Immigrants from Eastern Africa | Ethiopian |
| Minimum | $29,008 | $28,125 |
| Maximum | $75,954 | $77,898 |
| Range | $46,946 | $49,773 |
| Mean | $50,615 | $53,404 |
| Median | $51,138 | $54,292 |
| Interquartile 25% (IQ1) | $44,850 | $45,695 |
| Interquartile 75% (IQ3) | $56,361 | $61,784 |
| Interquartile Range (IQR) | $11,511 | $16,089 |
| Standard Deviation (Sample) | $9,130 | $11,871 |
| Standard Deviation (Population) | $9,055 | $11,744 |
Similar Demographics by Householder Income Under 25 years
Demographics Similar to Immigrants from Eastern Africa by Householder Income Under 25 years
In terms of householder income under 25 years, the demographic groups most similar to Immigrants from Eastern Africa are Immigrants from Germany ($51,190, a difference of 0.060%), Spaniard ($51,117, a difference of 0.080%), Serbian ($51,106, a difference of 0.10%), Arab ($51,219, a difference of 0.12%), and Czechoslovakian ($51,224, a difference of 0.13%).
| Demographics | Rating | Rank | Householder Income Under 25 years |
| Zimbabweans | 9.3 /100 | #214 | Tragic $51,259 |
| Icelanders | 9.1 /100 | #215 | Tragic $51,247 |
| French | 8.7 /100 | #216 | Tragic $51,230 |
| Czechoslovakians | 8.6 /100 | #217 | Tragic $51,224 |
| Immigrants | Belize | 8.6 /100 | #218 | Tragic $51,223 |
| Arabs | 8.5 /100 | #219 | Tragic $51,219 |
| Immigrants | Germany | 8.0 /100 | #220 | Tragic $51,190 |
| Immigrants | Eastern Africa | 7.4 /100 | #221 | Tragic $51,158 |
| Spaniards | 6.8 /100 | #222 | Tragic $51,117 |
| Serbians | 6.6 /100 | #223 | Tragic $51,106 |
| Belizeans | 6.4 /100 | #224 | Tragic $51,094 |
| Immigrants | Jamaica | 5.6 /100 | #225 | Tragic $51,038 |
| Yugoslavians | 5.5 /100 | #226 | Tragic $51,028 |
| Immigrants | Central America | 5.4 /100 | #227 | Tragic $51,022 |
| Immigrants | Norway | 5.0 /100 | #228 | Tragic $50,984 |
Demographics Similar to Ethiopians by Householder Income Under 25 years
In terms of householder income under 25 years, the demographic groups most similar to Ethiopians are Immigrants from France ($53,805, a difference of 0.020%), Ukrainian ($53,843, a difference of 0.050%), Albanian ($53,794, a difference of 0.050%), Australian ($53,739, a difference of 0.15%), and Maltese ($53,735, a difference of 0.15%).
| Demographics | Rating | Rank | Householder Income Under 25 years |
| Immigrants | Portugal | 99.1 /100 | #97 | Exceptional $54,105 |
| Eastern Europeans | 99.0 /100 | #98 | Exceptional $54,066 |
| Alaska Natives | 98.8 /100 | #99 | Exceptional $54,000 |
| Immigrants | Kazakhstan | 98.8 /100 | #100 | Exceptional $53,990 |
| South Americans | 98.6 /100 | #101 | Exceptional $53,939 |
| Ecuadorians | 98.5 /100 | #102 | Exceptional $53,911 |
| Ukrainians | 98.3 /100 | #103 | Exceptional $53,843 |
| Ethiopians | 98.2 /100 | #104 | Exceptional $53,818 |
| Immigrants | France | 98.1 /100 | #105 | Exceptional $53,805 |
| Albanians | 98.1 /100 | #106 | Exceptional $53,794 |
| Australians | 97.8 /100 | #107 | Exceptional $53,739 |
| Maltese | 97.8 /100 | #108 | Exceptional $53,735 |
| Immigrants | Ecuador | 97.7 /100 | #109 | Exceptional $53,722 |
| Greeks | 97.7 /100 | #110 | Exceptional $53,715 |
| Immigrants | Colombia | 97.7 /100 | #111 | Exceptional $53,714 |