Scotch-Irish vs Bahamian Median Family Income
COMPARE
Scotch-Irish
Bahamian
Median Family Income
Median Family Income Comparison
Scotch-Irish
Bahamians
$99,591
MEDIAN FAMILY INCOME
17.1/ 100
METRIC RATING
203rd/ 347
METRIC RANK
$82,631
MEDIAN FAMILY INCOME
0.0/ 100
METRIC RATING
323rd/ 347
METRIC RANK
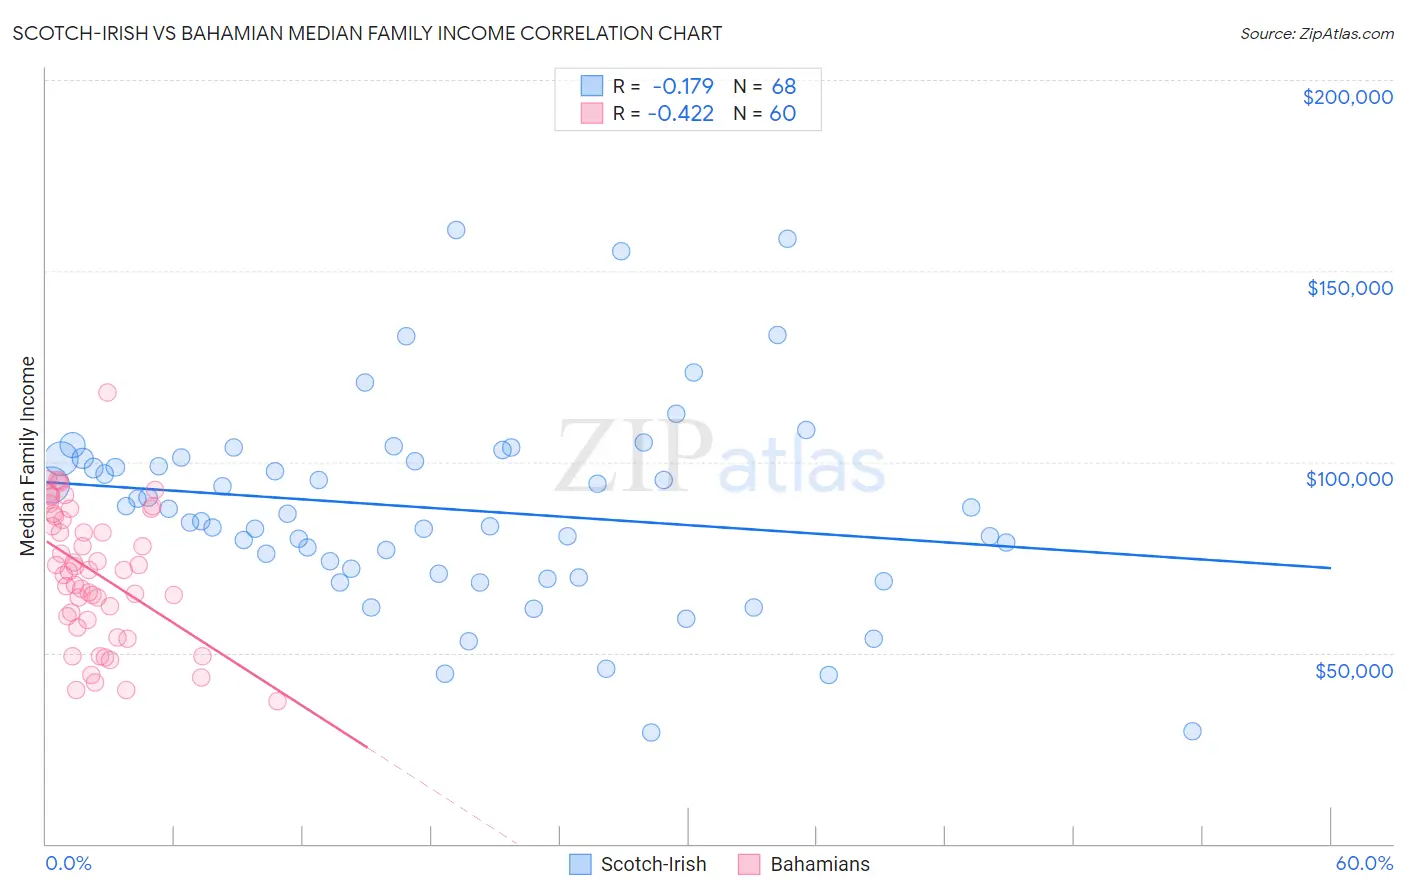
Scotch-Irish vs Bahamian Median Family Income Correlation Chart
The statistical analysis conducted on geographies consisting of 547,821,252 people shows a poor negative correlation between the proportion of Scotch-Irish and median family income in the United States with a correlation coefficient (R) of -0.179 and weighted average of $99,591. Similarly, the statistical analysis conducted on geographies consisting of 112,596,489 people shows a moderate negative correlation between the proportion of Bahamians and median family income in the United States with a correlation coefficient (R) of -0.422 and weighted average of $82,631, a difference of 20.5%.
Median Family Income Correlation Summary
| Measurement | Scotch-Irish | Bahamian |
| Minimum | $29,091 | $37,231 |
| Maximum | $160,619 | $118,067 |
| Range | $131,528 | $80,836 |
| Mean | $87,675 | $71,118 |
| Median | $87,122 | $71,812 |
| Interquartile 25% (IQ1) | $71,348 | $59,044 |
| Interquartile 75% (IQ3) | $100,856 | $86,176 |
| Interquartile Range (IQR) | $29,508 | $27,132 |
| Standard Deviation (Sample) | $26,299 | $17,647 |
| Standard Deviation (Population) | $26,105 | $17,499 |
Similar Demographics by Median Family Income
Demographics Similar to Scotch-Irish by Median Family Income
In terms of median family income, the demographic groups most similar to Scotch-Irish are White/Caucasian ($99,800, a difference of 0.21%), Immigrants from Thailand ($99,840, a difference of 0.25%), Spanish ($99,977, a difference of 0.39%), Yugoslavian ($100,119, a difference of 0.53%), and Immigrants from Africa ($100,256, a difference of 0.67%).
| Demographics | Rating | Rank | Median Family Income |
| Samoans | 23.3 /100 | #196 | Fair $100,344 |
| Immigrants | Cameroon | 22.8 /100 | #197 | Fair $100,289 |
| Immigrants | Africa | 22.5 /100 | #198 | Fair $100,256 |
| Yugoslavians | 21.3 /100 | #199 | Fair $100,119 |
| Spanish | 20.1 /100 | #200 | Fair $99,977 |
| Immigrants | Thailand | 19.0 /100 | #201 | Poor $99,840 |
| Whites/Caucasians | 18.7 /100 | #202 | Poor $99,800 |
| Scotch-Irish | 17.1 /100 | #203 | Poor $99,591 |
| Ghanaians | 12.6 /100 | #204 | Poor $98,877 |
| Hawaiians | 12.5 /100 | #205 | Poor $98,869 |
| Immigrants | Iraq | 12.1 /100 | #206 | Poor $98,786 |
| Aleuts | 11.6 /100 | #207 | Poor $98,702 |
| Immigrants | Uruguay | 9.2 /100 | #208 | Tragic $98,205 |
| Immigrants | Colombia | 8.7 /100 | #209 | Tragic $98,067 |
| Puget Sound Salish | 8.2 /100 | #210 | Tragic $97,958 |
Demographics Similar to Bahamians by Median Family Income
In terms of median family income, the demographic groups most similar to Bahamians are Creek ($82,560, a difference of 0.090%), Sioux ($82,386, a difference of 0.30%), Dominican ($82,888, a difference of 0.31%), Immigrants from Congo ($82,216, a difference of 0.51%), and Arapaho ($82,064, a difference of 0.69%).
| Demographics | Rating | Rank | Median Family Income |
| Immigrants | Haiti | 0.0 /100 | #316 | Tragic $84,018 |
| Yakama | 0.0 /100 | #317 | Tragic $83,932 |
| Immigrants | Mexico | 0.0 /100 | #318 | Tragic $83,639 |
| Immigrants | Honduras | 0.0 /100 | #319 | Tragic $83,618 |
| Seminole | 0.0 /100 | #320 | Tragic $83,354 |
| Immigrants | Caribbean | 0.0 /100 | #321 | Tragic $83,319 |
| Dominicans | 0.0 /100 | #322 | Tragic $82,888 |
| Bahamians | 0.0 /100 | #323 | Tragic $82,631 |
| Creek | 0.0 /100 | #324 | Tragic $82,560 |
| Sioux | 0.0 /100 | #325 | Tragic $82,386 |
| Immigrants | Congo | 0.0 /100 | #326 | Tragic $82,216 |
| Arapaho | 0.0 /100 | #327 | Tragic $82,064 |
| Blacks/African Americans | 0.0 /100 | #328 | Tragic $81,912 |
| Dutch West Indians | 0.0 /100 | #329 | Tragic $81,852 |
| Cheyenne | 0.0 /100 | #330 | Tragic $81,385 |