Malaysian vs Bahamian Median Family Income
COMPARE
Malaysian
Bahamian
Median Family Income
Median Family Income Comparison
Malaysians
Bahamians
$95,230
MEDIAN FAMILY INCOME
2.2/ 100
METRIC RATING
230th/ 347
METRIC RANK
$82,631
MEDIAN FAMILY INCOME
0.0/ 100
METRIC RATING
323rd/ 347
METRIC RANK
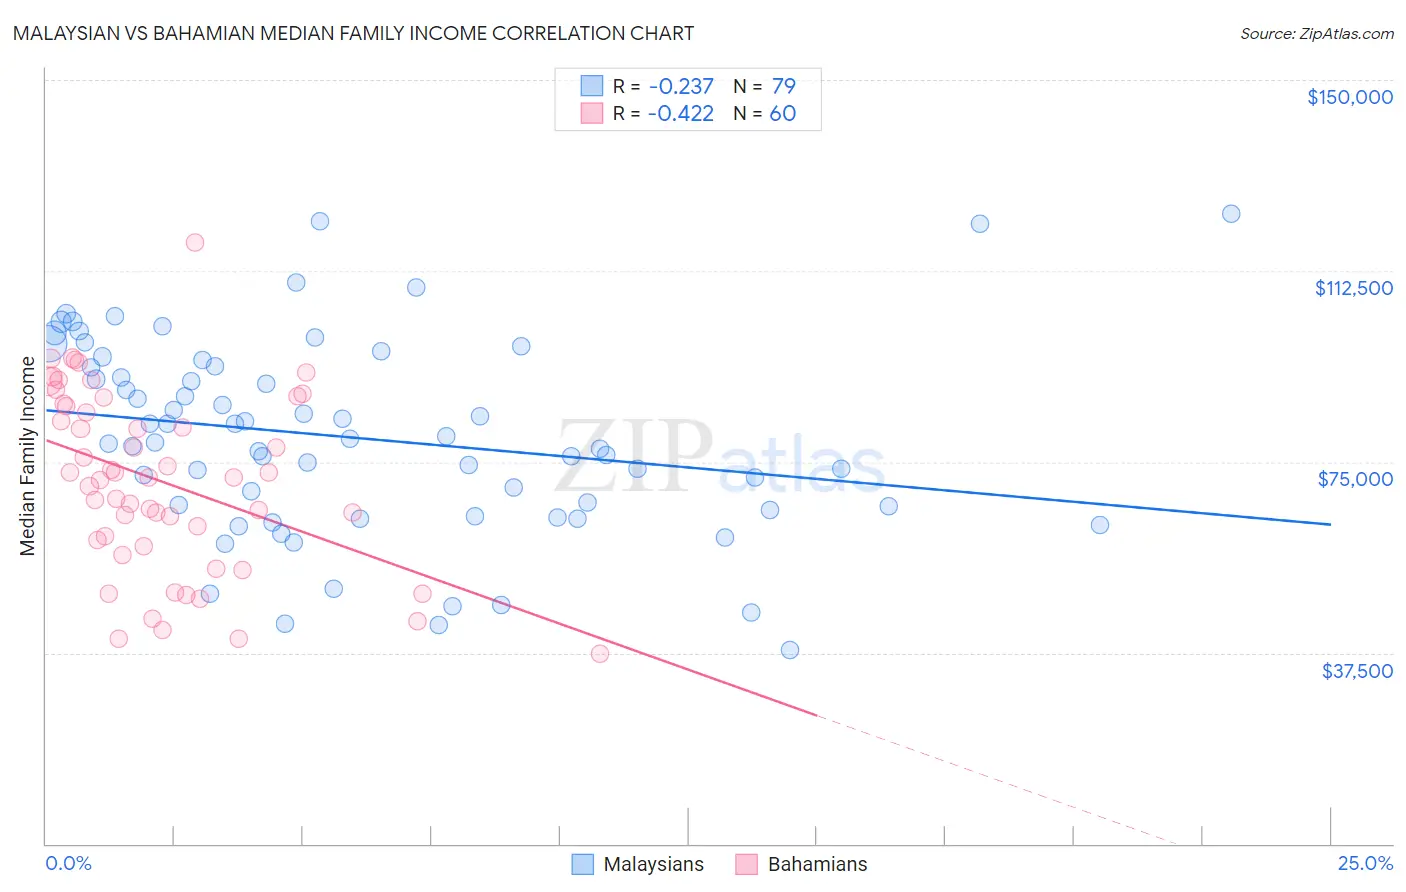
Malaysian vs Bahamian Median Family Income Correlation Chart
The statistical analysis conducted on geographies consisting of 225,953,352 people shows a weak negative correlation between the proportion of Malaysians and median family income in the United States with a correlation coefficient (R) of -0.237 and weighted average of $95,230. Similarly, the statistical analysis conducted on geographies consisting of 112,596,489 people shows a moderate negative correlation between the proportion of Bahamians and median family income in the United States with a correlation coefficient (R) of -0.422 and weighted average of $82,631, a difference of 15.2%.
Median Family Income Correlation Summary
| Measurement | Malaysian | Bahamian |
| Minimum | $38,021 | $37,231 |
| Maximum | $123,750 | $118,067 |
| Range | $85,729 | $80,836 |
| Mean | $79,701 | $71,118 |
| Median | $78,842 | $71,812 |
| Interquartile 25% (IQ1) | $65,625 | $59,044 |
| Interquartile 75% (IQ3) | $93,739 | $86,176 |
| Interquartile Range (IQR) | $28,114 | $27,132 |
| Standard Deviation (Sample) | $19,147 | $17,647 |
| Standard Deviation (Population) | $19,025 | $17,499 |
Similar Demographics by Median Family Income
Demographics Similar to Malaysians by Median Family Income
In terms of median family income, the demographic groups most similar to Malaysians are Marshallese ($95,293, a difference of 0.070%), Ecuadorian ($95,114, a difference of 0.12%), Immigrants from the Azores ($95,402, a difference of 0.18%), Immigrants from Venezuela ($94,904, a difference of 0.34%), and Alaska Native ($95,573, a difference of 0.36%).
| Demographics | Rating | Rank | Median Family Income |
| Venezuelans | 3.7 /100 | #223 | Tragic $96,281 |
| Immigrants | Nonimmigrants | 3.6 /100 | #224 | Tragic $96,231 |
| Vietnamese | 3.4 /100 | #225 | Tragic $96,123 |
| Immigrants | Panama | 2.7 /100 | #226 | Tragic $95,647 |
| Alaska Natives | 2.6 /100 | #227 | Tragic $95,573 |
| Immigrants | Azores | 2.4 /100 | #228 | Tragic $95,402 |
| Marshallese | 2.2 /100 | #229 | Tragic $95,293 |
| Malaysians | 2.2 /100 | #230 | Tragic $95,230 |
| Ecuadorians | 2.1 /100 | #231 | Tragic $95,114 |
| Immigrants | Venezuela | 1.9 /100 | #232 | Tragic $94,904 |
| Immigrants | Bangladesh | 1.6 /100 | #233 | Tragic $94,665 |
| Immigrants | Western Africa | 1.6 /100 | #234 | Tragic $94,638 |
| Immigrants | Burma/Myanmar | 1.5 /100 | #235 | Tragic $94,472 |
| Trinidadians and Tobagonians | 1.5 /100 | #236 | Tragic $94,466 |
| Alaskan Athabascans | 1.5 /100 | #237 | Tragic $94,429 |
Demographics Similar to Bahamians by Median Family Income
In terms of median family income, the demographic groups most similar to Bahamians are Creek ($82,560, a difference of 0.090%), Sioux ($82,386, a difference of 0.30%), Dominican ($82,888, a difference of 0.31%), Immigrants from Congo ($82,216, a difference of 0.51%), and Arapaho ($82,064, a difference of 0.69%).
| Demographics | Rating | Rank | Median Family Income |
| Immigrants | Haiti | 0.0 /100 | #316 | Tragic $84,018 |
| Yakama | 0.0 /100 | #317 | Tragic $83,932 |
| Immigrants | Mexico | 0.0 /100 | #318 | Tragic $83,639 |
| Immigrants | Honduras | 0.0 /100 | #319 | Tragic $83,618 |
| Seminole | 0.0 /100 | #320 | Tragic $83,354 |
| Immigrants | Caribbean | 0.0 /100 | #321 | Tragic $83,319 |
| Dominicans | 0.0 /100 | #322 | Tragic $82,888 |
| Bahamians | 0.0 /100 | #323 | Tragic $82,631 |
| Creek | 0.0 /100 | #324 | Tragic $82,560 |
| Sioux | 0.0 /100 | #325 | Tragic $82,386 |
| Immigrants | Congo | 0.0 /100 | #326 | Tragic $82,216 |
| Arapaho | 0.0 /100 | #327 | Tragic $82,064 |
| Blacks/African Americans | 0.0 /100 | #328 | Tragic $81,912 |
| Dutch West Indians | 0.0 /100 | #329 | Tragic $81,852 |
| Cheyenne | 0.0 /100 | #330 | Tragic $81,385 |