Scotch-Irish vs Bahamian 12th Grade, No Diploma
COMPARE
Scotch-Irish
Bahamian
12th Grade, No Diploma
12th Grade, No Diploma Comparison
Scotch-Irish
Bahamians
92.4%
12TH GRADE, NO DIPLOMA
98.8/ 100
METRIC RATING
88th/ 347
METRIC RANK
89.9%
12TH GRADE, NO DIPLOMA
0.9/ 100
METRIC RATING
252nd/ 347
METRIC RANK
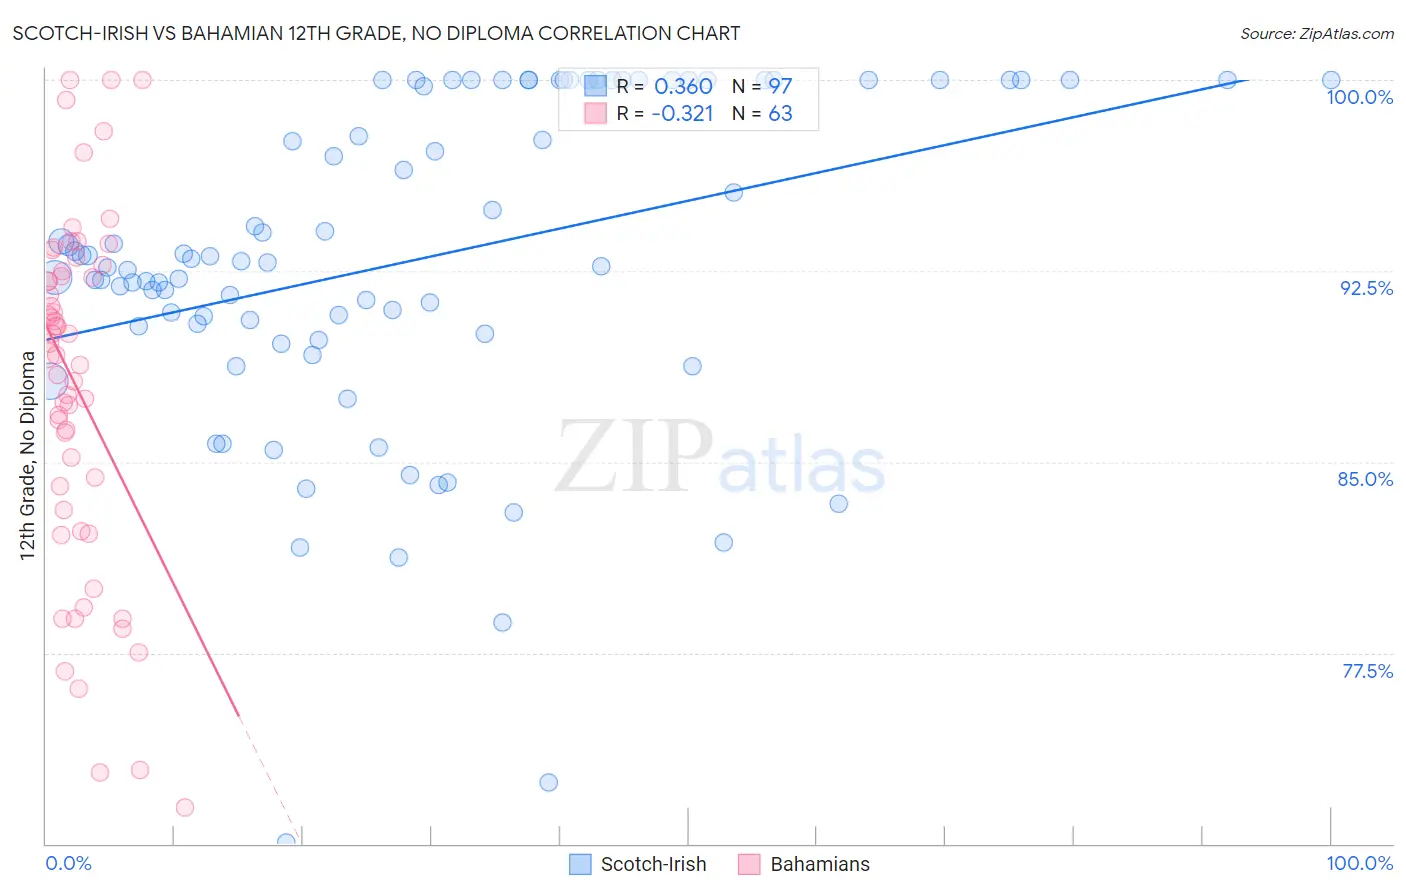
Scotch-Irish vs Bahamian 12th Grade, No Diploma Correlation Chart
The statistical analysis conducted on geographies consisting of 548,779,904 people shows a mild positive correlation between the proportion of Scotch-Irish and percentage of population with at least 12th grade (no diploma) education in the United States with a correlation coefficient (R) of 0.360 and weighted average of 92.4%. Similarly, the statistical analysis conducted on geographies consisting of 112,698,819 people shows a mild negative correlation between the proportion of Bahamians and percentage of population with at least 12th grade (no diploma) education in the United States with a correlation coefficient (R) of -0.321 and weighted average of 89.9%, a difference of 2.8%.
12th Grade, No Diploma Correlation Summary
| Measurement | Scotch-Irish | Bahamian |
| Minimum | 70.0% | 71.4% |
| Maximum | 100.0% | 100.0% |
| Range | 30.0% | 28.6% |
| Mean | 92.9% | 87.9% |
| Median | 92.9% | 89.2% |
| Interquartile 25% (IQ1) | 90.2% | 83.1% |
| Interquartile 75% (IQ3) | 100.0% | 92.5% |
| Interquartile Range (IQR) | 9.8% | 9.4% |
| Standard Deviation (Sample) | 6.4% | 6.9% |
| Standard Deviation (Population) | 6.4% | 6.9% |
Similar Demographics by 12th Grade, No Diploma
Demographics Similar to Scotch-Irish by 12th Grade, No Diploma
In terms of 12th grade, no diploma, the demographic groups most similar to Scotch-Irish are Immigrants from France (92.4%, a difference of 0.010%), Immigrants from Turkey (92.4%, a difference of 0.030%), Canadian (92.4%, a difference of 0.030%), Immigrants from Serbia (92.4%, a difference of 0.040%), and South African (92.4%, a difference of 0.040%).
| Demographics | Rating | Rank | 12th Grade, No Diploma |
| Immigrants | Denmark | 99.2 /100 | #81 | Exceptional 92.5% |
| Immigrants | Switzerland | 99.2 /100 | #82 | Exceptional 92.5% |
| Immigrants | Israel | 99.2 /100 | #83 | Exceptional 92.5% |
| Immigrants | Bulgaria | 99.1 /100 | #84 | Exceptional 92.5% |
| Immigrants | Saudi Arabia | 99.0 /100 | #85 | Exceptional 92.5% |
| Immigrants | Turkey | 98.9 /100 | #86 | Exceptional 92.4% |
| Immigrants | France | 98.8 /100 | #87 | Exceptional 92.4% |
| Scotch-Irish | 98.8 /100 | #88 | Exceptional 92.4% |
| Canadians | 98.7 /100 | #89 | Exceptional 92.4% |
| Immigrants | Serbia | 98.6 /100 | #90 | Exceptional 92.4% |
| South Africans | 98.6 /100 | #91 | Exceptional 92.4% |
| Immigrants | Romania | 98.5 /100 | #92 | Exceptional 92.3% |
| Immigrants | Western Europe | 98.5 /100 | #93 | Exceptional 92.3% |
| Immigrants | Europe | 98.5 /100 | #94 | Exceptional 92.3% |
| Immigrants | North Macedonia | 98.5 /100 | #95 | Exceptional 92.3% |
Demographics Similar to Bahamians by 12th Grade, No Diploma
In terms of 12th grade, no diploma, the demographic groups most similar to Bahamians are Spanish American (89.9%, a difference of 0.0%), Immigrants from Eritrea (89.9%, a difference of 0.010%), Comanche (89.9%, a difference of 0.050%), Senegalese (89.9%, a difference of 0.050%), and Choctaw (89.8%, a difference of 0.080%).
| Demographics | Rating | Rank | 12th Grade, No Diploma |
| Immigrants | Uruguay | 1.4 /100 | #245 | Tragic 90.0% |
| Ghanaians | 1.3 /100 | #246 | Tragic 90.0% |
| Immigrants | Nigeria | 1.3 /100 | #247 | Tragic 89.9% |
| Comanche | 1.1 /100 | #248 | Tragic 89.9% |
| Senegalese | 1.1 /100 | #249 | Tragic 89.9% |
| Immigrants | Eritrea | 1.0 /100 | #250 | Tragic 89.9% |
| Spanish Americans | 0.9 /100 | #251 | Tragic 89.9% |
| Bahamians | 0.9 /100 | #252 | Tragic 89.9% |
| Choctaw | 0.7 /100 | #253 | Tragic 89.8% |
| Immigrants | Peru | 0.5 /100 | #254 | Tragic 89.7% |
| Immigrants | Senegal | 0.5 /100 | #255 | Tragic 89.7% |
| Immigrants | Ghana | 0.5 /100 | #256 | Tragic 89.7% |
| Jamaicans | 0.5 /100 | #257 | Tragic 89.7% |
| Africans | 0.4 /100 | #258 | Tragic 89.6% |
| Immigrants | Western Africa | 0.4 /100 | #259 | Tragic 89.6% |