Scotch-Irish vs Immigrants from Chile Median Family Income
COMPARE
Scotch-Irish
Immigrants from Chile
Median Family Income
Median Family Income Comparison
Scotch-Irish
Immigrants from Chile
$99,591
MEDIAN FAMILY INCOME
17.1/ 100
METRIC RATING
203rd/ 347
METRIC RANK
$105,655
MEDIAN FAMILY INCOME
82.1/ 100
METRIC RATING
147th/ 347
METRIC RANK
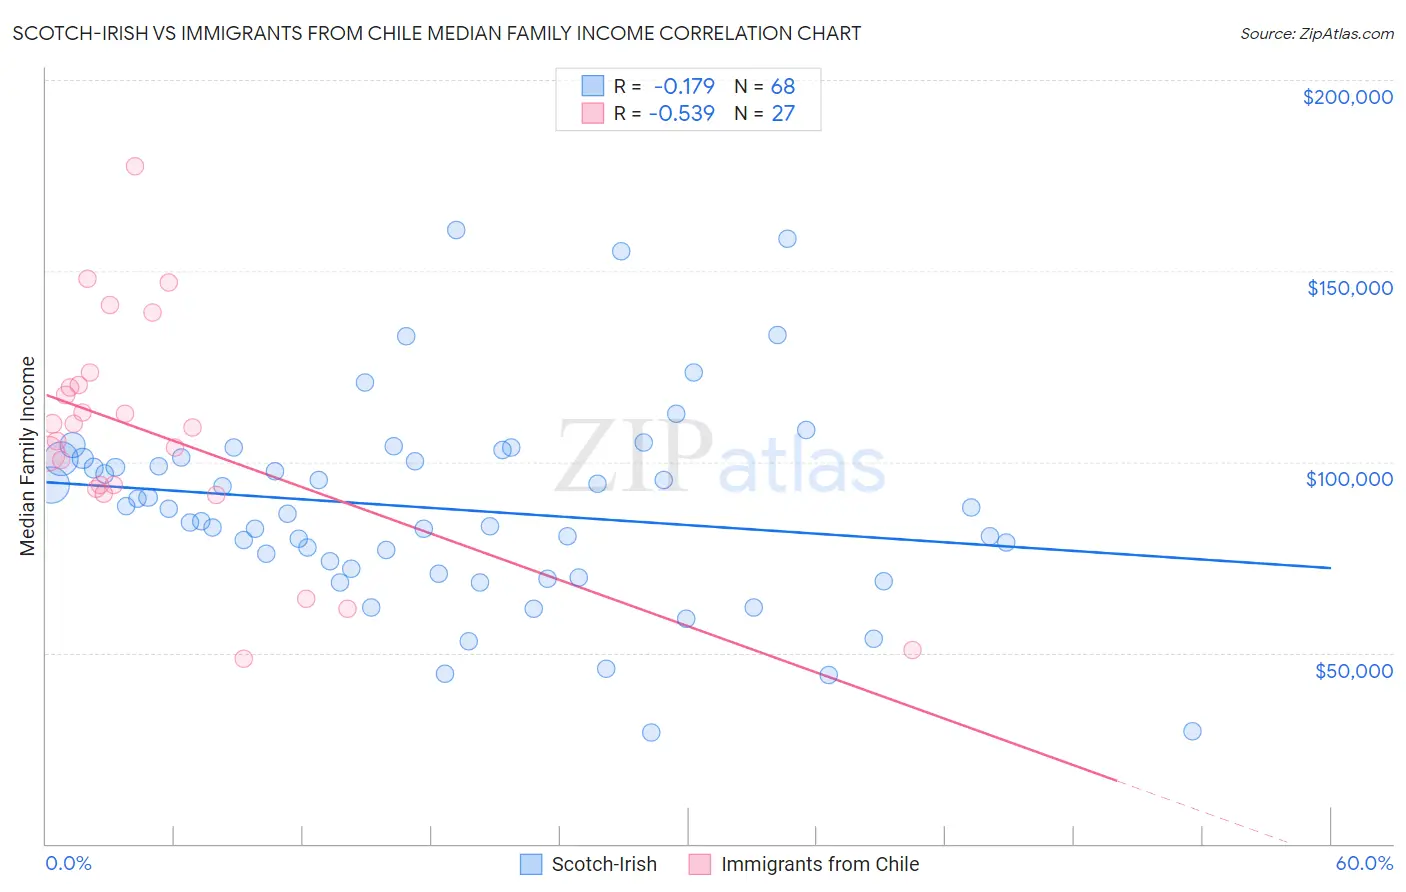
Scotch-Irish vs Immigrants from Chile Median Family Income Correlation Chart
The statistical analysis conducted on geographies consisting of 547,821,252 people shows a poor negative correlation between the proportion of Scotch-Irish and median family income in the United States with a correlation coefficient (R) of -0.179 and weighted average of $99,591. Similarly, the statistical analysis conducted on geographies consisting of 218,577,241 people shows a substantial negative correlation between the proportion of Immigrants from Chile and median family income in the United States with a correlation coefficient (R) of -0.539 and weighted average of $105,655, a difference of 6.1%.
Median Family Income Correlation Summary
| Measurement | Scotch-Irish | Immigrants from Chile |
| Minimum | $29,091 | $48,403 |
| Maximum | $160,619 | $177,440 |
| Range | $131,528 | $129,037 |
| Mean | $87,675 | $106,979 |
| Median | $87,122 | $109,000 |
| Interquartile 25% (IQ1) | $71,348 | $92,919 |
| Interquartile 75% (IQ3) | $100,856 | $120,092 |
| Interquartile Range (IQR) | $29,508 | $27,173 |
| Standard Deviation (Sample) | $26,299 | $29,634 |
| Standard Deviation (Population) | $26,105 | $29,080 |
Similar Demographics by Median Family Income
Demographics Similar to Scotch-Irish by Median Family Income
In terms of median family income, the demographic groups most similar to Scotch-Irish are White/Caucasian ($99,800, a difference of 0.21%), Immigrants from Thailand ($99,840, a difference of 0.25%), Spanish ($99,977, a difference of 0.39%), Yugoslavian ($100,119, a difference of 0.53%), and Immigrants from Africa ($100,256, a difference of 0.67%).
| Demographics | Rating | Rank | Median Family Income |
| Samoans | 23.3 /100 | #196 | Fair $100,344 |
| Immigrants | Cameroon | 22.8 /100 | #197 | Fair $100,289 |
| Immigrants | Africa | 22.5 /100 | #198 | Fair $100,256 |
| Yugoslavians | 21.3 /100 | #199 | Fair $100,119 |
| Spanish | 20.1 /100 | #200 | Fair $99,977 |
| Immigrants | Thailand | 19.0 /100 | #201 | Poor $99,840 |
| Whites/Caucasians | 18.7 /100 | #202 | Poor $99,800 |
| Scotch-Irish | 17.1 /100 | #203 | Poor $99,591 |
| Ghanaians | 12.6 /100 | #204 | Poor $98,877 |
| Hawaiians | 12.5 /100 | #205 | Poor $98,869 |
| Immigrants | Iraq | 12.1 /100 | #206 | Poor $98,786 |
| Aleuts | 11.6 /100 | #207 | Poor $98,702 |
| Immigrants | Uruguay | 9.2 /100 | #208 | Tragic $98,205 |
| Immigrants | Colombia | 8.7 /100 | #209 | Tragic $98,067 |
| Puget Sound Salish | 8.2 /100 | #210 | Tragic $97,958 |
Demographics Similar to Immigrants from Chile by Median Family Income
In terms of median family income, the demographic groups most similar to Immigrants from Chile are Hungarian ($105,609, a difference of 0.040%), Immigrants from Germany ($105,507, a difference of 0.14%), Czech ($105,839, a difference of 0.17%), Irish ($105,453, a difference of 0.19%), and Peruvian ($105,444, a difference of 0.20%).
| Demographics | Rating | Rank | Median Family Income |
| Norwegians | 85.5 /100 | #140 | Excellent $106,144 |
| Immigrants | Syria | 85.3 /100 | #141 | Excellent $106,118 |
| Slovenes | 84.7 /100 | #142 | Excellent $106,020 |
| Tongans | 84.3 /100 | #143 | Excellent $105,967 |
| Immigrants | Morocco | 84.3 /100 | #144 | Excellent $105,964 |
| Danes | 83.8 /100 | #145 | Excellent $105,900 |
| Czechs | 83.4 /100 | #146 | Excellent $105,839 |
| Immigrants | Chile | 82.1 /100 | #147 | Excellent $105,655 |
| Hungarians | 81.7 /100 | #148 | Excellent $105,609 |
| Immigrants | Germany | 80.9 /100 | #149 | Excellent $105,507 |
| Irish | 80.5 /100 | #150 | Excellent $105,453 |
| Peruvians | 80.4 /100 | #151 | Excellent $105,444 |
| Immigrants | Albania | 79.1 /100 | #152 | Good $105,285 |
| Slavs | 77.9 /100 | #153 | Good $105,144 |
| Immigrants | Nepal | 76.3 /100 | #154 | Good $104,966 |