Immigrants from Caribbean vs Romanian Median Family Income
COMPARE
Immigrants from Caribbean
Romanian
Median Family Income
Median Family Income Comparison
Immigrants from Caribbean
Romanians
$83,319
MEDIAN FAMILY INCOME
0.0/ 100
METRIC RATING
321st/ 347
METRIC RANK
$111,243
MEDIAN FAMILY INCOME
98.8/ 100
METRIC RATING
88th/ 347
METRIC RANK
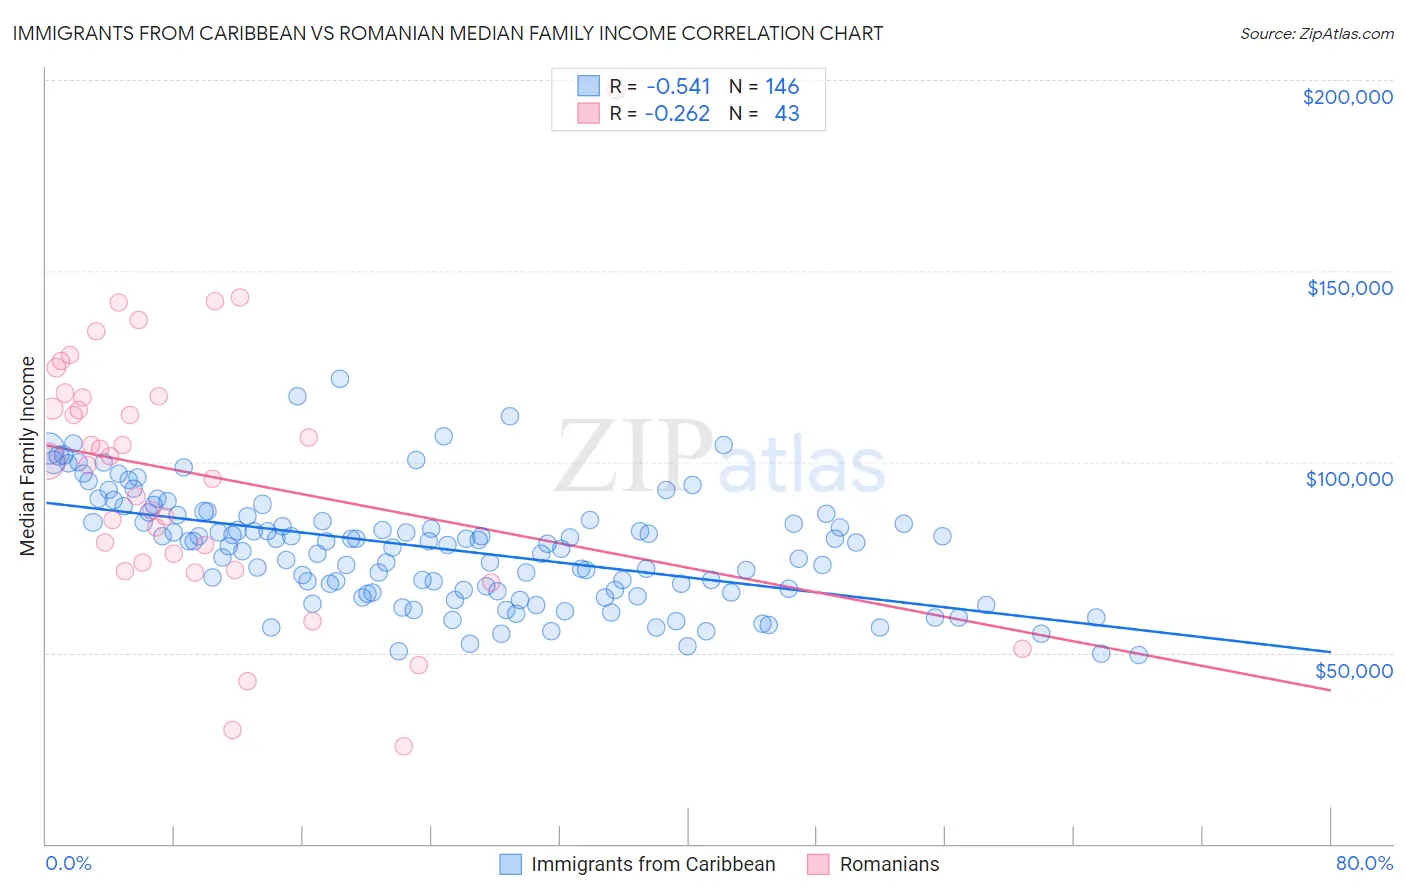
Immigrants from Caribbean vs Romanian Median Family Income Correlation Chart
The statistical analysis conducted on geographies consisting of 449,450,188 people shows a substantial negative correlation between the proportion of Immigrants from Caribbean and median family income in the United States with a correlation coefficient (R) of -0.541 and weighted average of $83,319. Similarly, the statistical analysis conducted on geographies consisting of 377,611,628 people shows a weak negative correlation between the proportion of Romanians and median family income in the United States with a correlation coefficient (R) of -0.262 and weighted average of $111,243, a difference of 33.5%.
Median Family Income Correlation Summary
| Measurement | Immigrants from Caribbean | Romanian |
| Minimum | $49,547 | $25,417 |
| Maximum | $121,711 | $197,500 |
| Range | $72,164 | $172,083 |
| Mean | $77,294 | $96,934 |
| Median | $78,717 | $100,017 |
| Interquartile 25% (IQ1) | $66,192 | $73,551 |
| Interquartile 75% (IQ3) | $85,685 | $117,024 |
| Interquartile Range (IQR) | $19,492 | $43,473 |
| Standard Deviation (Sample) | $14,692 | $33,876 |
| Standard Deviation (Population) | $14,641 | $33,480 |
Similar Demographics by Median Family Income
Demographics Similar to Immigrants from Caribbean by Median Family Income
In terms of median family income, the demographic groups most similar to Immigrants from Caribbean are Seminole ($83,354, a difference of 0.040%), Immigrants from Honduras ($83,618, a difference of 0.36%), Immigrants from Mexico ($83,639, a difference of 0.38%), Dominican ($82,888, a difference of 0.52%), and Yakama ($83,932, a difference of 0.74%).
| Demographics | Rating | Rank | Median Family Income |
| Immigrants | Bahamas | 0.0 /100 | #314 | Tragic $84,732 |
| Apache | 0.0 /100 | #315 | Tragic $84,451 |
| Immigrants | Haiti | 0.0 /100 | #316 | Tragic $84,018 |
| Yakama | 0.0 /100 | #317 | Tragic $83,932 |
| Immigrants | Mexico | 0.0 /100 | #318 | Tragic $83,639 |
| Immigrants | Honduras | 0.0 /100 | #319 | Tragic $83,618 |
| Seminole | 0.0 /100 | #320 | Tragic $83,354 |
| Immigrants | Caribbean | 0.0 /100 | #321 | Tragic $83,319 |
| Dominicans | 0.0 /100 | #322 | Tragic $82,888 |
| Bahamians | 0.0 /100 | #323 | Tragic $82,631 |
| Creek | 0.0 /100 | #324 | Tragic $82,560 |
| Sioux | 0.0 /100 | #325 | Tragic $82,386 |
| Immigrants | Congo | 0.0 /100 | #326 | Tragic $82,216 |
| Arapaho | 0.0 /100 | #327 | Tragic $82,064 |
| Blacks/African Americans | 0.0 /100 | #328 | Tragic $81,912 |
Demographics Similar to Romanians by Median Family Income
In terms of median family income, the demographic groups most similar to Romanians are Austrian ($111,306, a difference of 0.060%), Croatian ($111,370, a difference of 0.11%), Ukrainian ($111,368, a difference of 0.11%), Immigrants from Hungary ($111,378, a difference of 0.12%), and Immigrants from Argentina ($110,873, a difference of 0.33%).
| Demographics | Rating | Rank | Median Family Income |
| Immigrants | North America | 99.2 /100 | #81 | Exceptional $112,151 |
| Immigrants | England | 99.2 /100 | #82 | Exceptional $112,038 |
| Immigrants | Egypt | 99.0 /100 | #83 | Exceptional $111,689 |
| Immigrants | Hungary | 98.8 /100 | #84 | Exceptional $111,378 |
| Croatians | 98.8 /100 | #85 | Exceptional $111,370 |
| Ukrainians | 98.8 /100 | #86 | Exceptional $111,368 |
| Austrians | 98.8 /100 | #87 | Exceptional $111,306 |
| Romanians | 98.8 /100 | #88 | Exceptional $111,243 |
| Immigrants | Argentina | 98.5 /100 | #89 | Exceptional $110,873 |
| Northern Europeans | 98.3 /100 | #90 | Exceptional $110,635 |
| Immigrants | Southern Europe | 98.3 /100 | #91 | Exceptional $110,614 |
| Immigrants | Lebanon | 97.9 /100 | #92 | Exceptional $110,159 |
| Immigrants | Kazakhstan | 97.8 /100 | #93 | Exceptional $110,137 |
| Koreans | 97.8 /100 | #94 | Exceptional $110,103 |
| Zimbabweans | 97.7 /100 | #95 | Exceptional $110,011 |