Pima vs Immigrants from Australia Bachelor's Degree

COMPARE

Pima
Race
Ancestry
AfghanAfricanAlaska NativeAlaskan AthabascanAlbanianAleutAlsatianAmericanApacheArabArapahoArgentineanArmenianAssyrian/Chaldean/SyriacAustralianAustrianBahamianBangladeshiBarbadianBasqueBelgianBelizeanBermudanBhutaneseBlackfeetBolivianBrazilianBritishBritish West IndianBulgarianBurmeseCajunCambodianCanadianCape VerdeanCarpatho RusynCelticCentral AmericanCentral American IndianCherokeeCheyenneChickasawChileanChineseChippewaChoctawColombianColvilleComancheCosta RicanCreeCreekCroatianCrowCubanCypriotCzechCzechoslovakianDanishDelawareDominicanDutchDutch West IndianEastern EuropeanEcuadorianEgyptianEnglishEstonianEthiopianEuropeanFijianFilipinoFinnishFrenchFrench American IndianFrench CanadianGermanGerman RussianGhanaianGreekGuamanian/ChamorroGuatemalanGuyaneseHaitianHmongHonduranHopiHoumaHungarianIcelanderIndian (Asian)IndonesianInupiatIranianIraqiIrishIroquoisIsraeliItalianJamaicanJapaneseJordanianKenyanKiowaKoreanLaotianLatvianLebaneseLiberianLithuanianLumbeeLuxembourgerMacedonianMalaysianMalteseMarshalleseMenomineeMexicanMexican American IndianMongolianMoroccanNative HawaiianNavajoNepaleseNew ZealanderNicaraguanNigerianNorthern EuropeanNorwegianOkinawanOsageOttawaPaiutePakistaniPalestinianPanamanianParaguayanPennsylvania GermanPeruvianPimaPolishPortuguesePotawatomiPuebloPuerto RicanPuget Sound SalishRomanianRussianSalvadoranSamoanScandinavianScotch-IrishScottishSeminoleSenegaleseSerbianShoshoneSierra LeoneanSiouxSlavicSlovakSloveneSomaliSouth AfricanSouth AmericanSouth American IndianSoviet UnionSpaniardSpanishSpanish AmericanSpanish American IndianSri LankanSubsaharan AfricanSudaneseSwedishSwissSyrianTaiwaneseThaiTlingit-HaidaTohono O'OdhamTonganTrinidadian and TobagonianTsimshianTurkishU.S. Virgin IslanderUgandanUkrainianUruguayanUteVenezuelanVietnameseWelshWest IndianYakamaYaquiYugoslavianYumanYup'ikZimbabwean
Immigration
NonimmigrantsImmigrantsAfghanistanAfricaAlbaniaArgentinaArmeniaAsiaAustriaBahamasBangladeshBarbadosBelarusBelgiumBelizeBoliviaBosnia and HerzegovinaBrazilBulgariaBurma/MyanmarCabo VerdeCambodiaCameroonCanadaCaribbeanCentral AmericaChileChinaColombiaCongoCosta RicaCroatiaCubaCzechoslovakiaDenmarkDominicaDominican RepublicEastern AfricaEastern AsiaEastern EuropeEcuadorEgyptEl SalvadorEnglandEritreaEthiopiaEuropeFijiFranceGermanyGhanaGreeceGrenadaGuatemalaGuyanaHaitiHondurasHong KongHungaryIndiaIndonesiaIranIraqIrelandIsraelItalyJamaicaJapanJordanKazakhstanKenyaKoreaKuwaitLaosLatin AmericaLatviaLebanonLiberiaLithuaniaMalaysiaMexicoMicronesiaMiddle AfricaMoldovaMoroccoNepalNetherlandsNicaraguaNigeriaNorth AmericaNorth MacedoniaNorthern AfricaNorthern EuropeNorwayOceaniaPakistanPanamaPeruPhilippinesPolandPortugalRomaniaRussiaSaudi ArabiaScotlandSenegalSerbiaSierra LeoneSingaporeSomaliaSouth AfricaSouth AmericaSouth Central AsiaSouth Eastern AsiaSouthern EuropeSpainSri LankaSt. Vincent and the GrenadinesSudanSwedenSwitzerlandSyriaTaiwanThailandTrinidad and TobagoTurkeyUgandaUkraineUruguayUzbekistanVenezuelaVietnamWest IndiesWestern AfricaWestern AsiaWestern EuropeYemenZaireZimbabweAzores
Immigrants from Australia
Race
Ancestry
AfghanAfricanAlaska NativeAlaskan AthabascanAlbanianAleutAlsatianAmericanApacheArabArapahoArgentineanArmenianAssyrian/Chaldean/SyriacAustralianAustrianBahamianBangladeshiBarbadianBasqueBelgianBelizeanBermudanBhutaneseBlackfeetBolivianBrazilianBritishBritish West IndianBulgarianBurmeseCajunCambodianCanadianCape VerdeanCarpatho RusynCelticCentral AmericanCentral American IndianCherokeeCheyenneChickasawChileanChineseChippewaChoctawColombianColvilleComancheCosta RicanCreeCreekCroatianCrowCubanCypriotCzechCzechoslovakianDanishDelawareDominicanDutchDutch West IndianEastern EuropeanEcuadorianEgyptianEnglishEstonianEthiopianEuropeanFijianFilipinoFinnishFrenchFrench American IndianFrench CanadianGermanGerman RussianGhanaianGreekGuamanian/ChamorroGuatemalanGuyaneseHaitianHmongHonduranHopiHoumaHungarianIcelanderIndian (Asian)IndonesianInupiatIranianIraqiIrishIroquoisIsraeliItalianJamaicanJapaneseJordanianKenyanKiowaKoreanLaotianLatvianLebaneseLiberianLithuanianLumbeeLuxembourgerMacedonianMalaysianMalteseMarshalleseMenomineeMexicanMexican American IndianMongolianMoroccanNative HawaiianNavajoNepaleseNew ZealanderNicaraguanNigerianNorthern EuropeanNorwegianOkinawanOsageOttawaPaiutePakistaniPalestinianPanamanianParaguayanPennsylvania GermanPeruvianPolishPortuguesePotawatomiPuebloPuerto RicanPuget Sound SalishRomanianRussianSalvadoranSamoanScandinavianScotch-IrishScottishSeminoleSenegaleseSerbianShoshoneSierra LeoneanSiouxSlavicSlovakSloveneSomaliSouth AfricanSouth AmericanSouth American IndianSoviet UnionSpaniardSpanishSpanish AmericanSpanish American IndianSri LankanSubsaharan AfricanSudaneseSwedishSwissSyrianTaiwaneseThaiTlingit-HaidaTohono O'OdhamTonganTrinidadian and TobagonianTsimshianTurkishU.S. Virgin IslanderUgandanUkrainianUruguayanUteVenezuelanVietnameseWelshWest IndianYakamaYaquiYugoslavianYumanYup'ikZimbabwean
Immigration
NonimmigrantsImmigrantsAfghanistanAfricaAlbaniaArgentinaArmeniaAsiaAustraliaAustriaBahamasBangladeshBarbadosBelarusBelgiumBelizeBoliviaBosnia and HerzegovinaBrazilBulgariaBurma/MyanmarCabo VerdeCambodiaCameroonCanadaCaribbeanCentral AmericaChileChinaColombiaCongoCosta RicaCroatiaCubaCzechoslovakiaDenmarkDominicaDominican RepublicEastern AfricaEastern AsiaEastern EuropeEcuadorEgyptEl SalvadorEnglandEritreaEthiopiaEuropeFijiFranceGermanyGhanaGreeceGrenadaGuatemalaGuyanaHaitiHondurasHong KongHungaryIndiaIndonesiaIranIraqIrelandIsraelItalyJamaicaJapanJordanKazakhstanKenyaKoreaKuwaitLaosLatin AmericaLatviaLebanonLiberiaLithuaniaMalaysiaMexicoMicronesiaMiddle AfricaMoldovaMoroccoNepalNetherlandsNicaraguaNigeriaNorth AmericaNorth MacedoniaNorthern AfricaNorthern EuropeNorwayOceaniaPakistanPanamaPeruPhilippinesPolandPortugalRomaniaRussiaSaudi ArabiaScotlandSenegalSerbiaSierra LeoneSingaporeSomaliaSouth AfricaSouth AmericaSouth Central AsiaSouth Eastern AsiaSouthern EuropeSpainSri LankaSt. Vincent and the GrenadinesSudanSwedenSwitzerlandSyriaTaiwanThailandTrinidad and TobagoTurkeyUgandaUkraineUruguayUzbekistanVenezuelaVietnamWest IndiesWestern AfricaWestern AsiaWestern EuropeYemenZaireZimbabweAzores
Bachelor's Degree
Income
Poverty
Unemployment
Labor Participation
Family Structure
Vehicle Availability
Education Level
Disability

Bachelor's Degree Comparison

Pima

Immigrants from Australia

Tragic
Exceptional
23.2%
BACHELOR'S DEGREE
0.0/ 100
METRIC RATING
345th/ 347
METRIC RANK
48.5%
BACHELOR'S DEGREE
100.0/ 100
METRIC RATING
11th/ 347
METRIC RANK

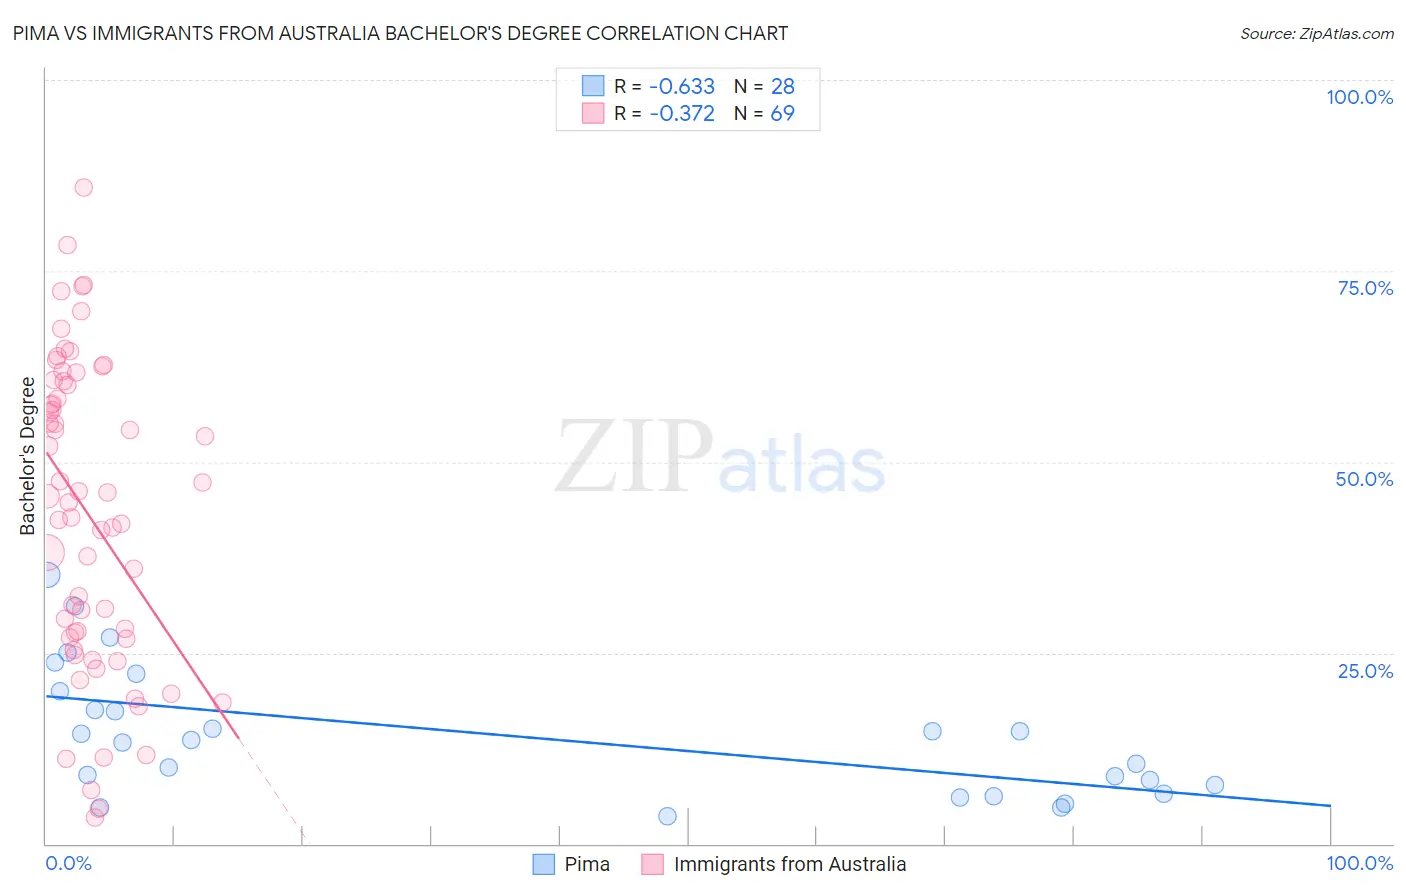
Pima vs Immigrants from Australia Bachelor's Degree Correlation Chart

The statistical analysis conducted on geographies consisting of 61,550,117 people shows a significant negative correlation between the proportion of Pima and percentage of population with at least bachelor's degree education in the United States with a correlation coefficient (R) of -0.633 and weighted average of 23.2%. Similarly, the statistical analysis conducted on geographies consisting of 227,197,750 people shows a mild negative correlation between the proportion of Immigrants from Australia and percentage of population with at least bachelor's degree education in the United States with a correlation coefficient (R) of -0.372 and weighted average of 48.5%, a difference of 109.0%.
Pima vs Immigrants from Australia Bachelor's Degree

Bachelor's Degree Correlation Summary

MeasurementPimaImmigrants from Australia
Minimum3.5%3.4%
Maximum35.2%85.9%
Range31.6%82.5%
Mean14.2%43.1%
Median13.4%44.7%
Interquartile 25% (IQ1)7.1%27.0%
Interquartile 75% (IQ3)18.7%60.3%
Interquartile Range (IQR)11.6%33.3%
Standard Deviation (Sample)8.5%19.9%
Standard Deviation (Population)8.3%19.8%

Similar Demographics by Bachelor's Degree

Demographics Similar to Pima by Bachelor's Degree

In terms of bachelor's degree, the demographic groups most similar to Pima are Navajo (23.6%, a difference of 1.8%), Tohono O'odham (24.4%, a difference of 5.2%), Yakama (24.5%, a difference of 5.4%), Yuman (24.5%, a difference of 5.7%), and Lumbee (24.8%, a difference of 6.7%).
DemographicsRating | RankBachelor's Degree
Mexicans
0.0
/100
|
#333
Tragic
27.1%
Arapaho
0.0
/100
|
#334
Tragic
26.6%
Natives/Alaskans
0.0
/100
|
#335
Tragic
26.3%
Immigrants | Mexico
0.0
/100
|
#336
Tragic
26.1%
Inupiat
0.0
/100
|
#337
Tragic
25.8%
Pueblo
0.0
/100
|
#338
Tragic
25.5%
Hopi
0.0
/100
|
#339
Tragic
25.3%
Lumbee
0.0
/100
|
#340
Tragic
24.8%
Yuman
0.0
/100
|
#341
Tragic
24.5%
Yakama
0.0
/100
|
#342
Tragic
24.5%
Tohono O'odham
0.0
/100
|
#343
Tragic
24.4%
Navajo
0.0
/100
|
#344
Tragic
23.6%
Pima
0.0
/100
|
#345
Tragic
23.2%
Houma
0.0
/100
|
#346
Tragic
21.4%
Yup'ik
0.0
/100
|
#347
Tragic
19.4%

Demographics Similar to Immigrants from Australia by Bachelor's Degree

In terms of bachelor's degree, the demographic groups most similar to Immigrants from Australia are Immigrants from China (48.4%, a difference of 0.18%), Immigrants from South Central Asia (48.3%, a difference of 0.32%), Immigrants from Hong Kong (48.2%, a difference of 0.60%), Immigrants from Eastern Asia (48.1%, a difference of 0.74%), and Cypriot (49.0%, a difference of 1.1%).
DemographicsRating | RankBachelor's Degree
Immigrants | Taiwan
100.0
/100
|
#4
Exceptional
51.2%
Iranians
100.0
/100
|
#5
Exceptional
51.0%
Okinawans
100.0
/100
|
#6
Exceptional
50.5%
Immigrants | Iran
100.0
/100
|
#7
Exceptional
50.3%
Thais
100.0
/100
|
#8
Exceptional
50.1%
Immigrants | Israel
100.0
/100
|
#9
Exceptional
50.0%
Cypriots
100.0
/100
|
#10
Exceptional
49.0%
Immigrants | Australia
100.0
/100
|
#11
Exceptional
48.5%
Immigrants | China
100.0
/100
|
#12
Exceptional
48.4%
Immigrants | South Central Asia
100.0
/100
|
#13
Exceptional
48.3%
Immigrants | Hong Kong
100.0
/100
|
#14
Exceptional
48.2%
Immigrants | Eastern Asia
100.0
/100
|
#15
Exceptional
48.1%
Soviet Union
100.0
/100
|
#16
Exceptional
47.9%
Eastern Europeans
100.0
/100
|
#17
Exceptional
47.5%
Indians (Asian)
100.0
/100
|
#18
Exceptional
47.4%