Peruvian vs Immigrants from Micronesia Median Household Income
COMPARE
Peruvian
Immigrants from Micronesia
Median Household Income
Median Household Income Comparison
Peruvians
Immigrants from Micronesia
$90,261
MEDIAN HOUSEHOLD INCOME
96.5/ 100
METRIC RATING
113th/ 347
METRIC RANK
$75,574
MEDIAN HOUSEHOLD INCOME
0.2/ 100
METRIC RATING
275th/ 347
METRIC RANK
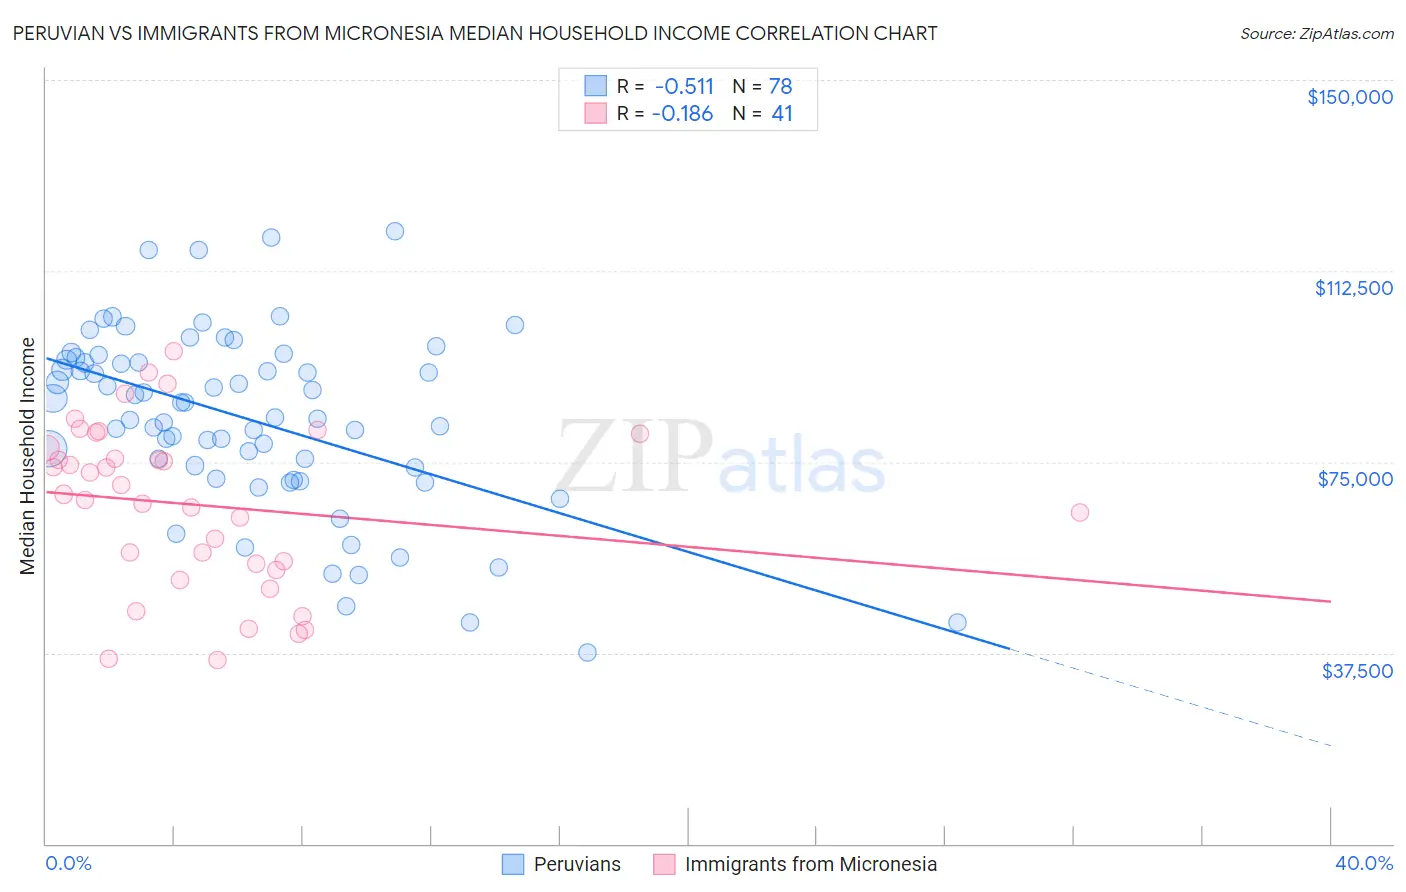
Peruvian vs Immigrants from Micronesia Median Household Income Correlation Chart
The statistical analysis conducted on geographies consisting of 362,893,410 people shows a substantial negative correlation between the proportion of Peruvians and median household income in the United States with a correlation coefficient (R) of -0.511 and weighted average of $90,261. Similarly, the statistical analysis conducted on geographies consisting of 61,597,439 people shows a poor negative correlation between the proportion of Immigrants from Micronesia and median household income in the United States with a correlation coefficient (R) of -0.186 and weighted average of $75,574, a difference of 19.4%.
Median Household Income Correlation Summary
| Measurement | Peruvian | Immigrants from Micronesia |
| Minimum | $37,557 | $36,071 |
| Maximum | $120,179 | $96,614 |
| Range | $82,622 | $60,543 |
| Mean | $83,404 | $66,523 |
| Median | $85,145 | $68,636 |
| Interquartile 25% (IQ1) | $73,839 | $54,388 |
| Interquartile 75% (IQ3) | $95,038 | $79,184 |
| Interquartile Range (IQR) | $21,199 | $24,796 |
| Standard Deviation (Sample) | $17,709 | $16,084 |
| Standard Deviation (Population) | $17,595 | $15,887 |
Similar Demographics by Median Household Income
Demographics Similar to Peruvians by Median Household Income
In terms of median household income, the demographic groups most similar to Peruvians are Northern European ($90,446, a difference of 0.20%), Immigrants from Northern Africa ($90,026, a difference of 0.26%), Immigrants from Western Asia ($90,005, a difference of 0.28%), Immigrants from Poland ($90,549, a difference of 0.32%), and Palestinian ($90,574, a difference of 0.35%).
| Demographics | Rating | Rank | Median Household Income |
| Macedonians | 97.4 /100 | #106 | Exceptional $90,761 |
| Croatians | 97.3 /100 | #107 | Exceptional $90,685 |
| Zimbabweans | 97.2 /100 | #108 | Exceptional $90,618 |
| Chileans | 97.2 /100 | #109 | Exceptional $90,605 |
| Palestinians | 97.1 /100 | #110 | Exceptional $90,574 |
| Immigrants | Poland | 97.1 /100 | #111 | Exceptional $90,549 |
| Northern Europeans | 96.9 /100 | #112 | Exceptional $90,446 |
| Peruvians | 96.5 /100 | #113 | Exceptional $90,261 |
| Immigrants | Northern Africa | 95.9 /100 | #114 | Exceptional $90,026 |
| Immigrants | Western Asia | 95.9 /100 | #115 | Exceptional $90,005 |
| Native Hawaiians | 95.7 /100 | #116 | Exceptional $89,919 |
| Taiwanese | 95.6 /100 | #117 | Exceptional $89,900 |
| Syrians | 95.4 /100 | #118 | Exceptional $89,830 |
| Albanians | 95.2 /100 | #119 | Exceptional $89,744 |
| Immigrants | North Macedonia | 95.2 /100 | #120 | Exceptional $89,741 |
Demographics Similar to Immigrants from Micronesia by Median Household Income
In terms of median household income, the demographic groups most similar to Immigrants from Micronesia are British West Indian ($75,647, a difference of 0.10%), Liberian ($75,667, a difference of 0.12%), Immigrants from Latin America ($75,420, a difference of 0.20%), Spanish American ($75,386, a difference of 0.25%), and Somali ($75,782, a difference of 0.27%).
| Demographics | Rating | Rank | Median Household Income |
| Immigrants | Jamaica | 0.3 /100 | #268 | Tragic $75,851 |
| Cape Verdeans | 0.3 /100 | #269 | Tragic $75,848 |
| Hmong | 0.3 /100 | #270 | Tragic $75,839 |
| Pennsylvania Germans | 0.3 /100 | #271 | Tragic $75,814 |
| Somalis | 0.3 /100 | #272 | Tragic $75,782 |
| Liberians | 0.2 /100 | #273 | Tragic $75,667 |
| British West Indians | 0.2 /100 | #274 | Tragic $75,647 |
| Immigrants | Micronesia | 0.2 /100 | #275 | Tragic $75,574 |
| Immigrants | Latin America | 0.2 /100 | #276 | Tragic $75,420 |
| Spanish Americans | 0.2 /100 | #277 | Tragic $75,386 |
| Osage | 0.2 /100 | #278 | Tragic $75,240 |
| Immigrants | Guatemala | 0.2 /100 | #279 | Tragic $75,123 |
| Senegalese | 0.2 /100 | #280 | Tragic $74,999 |
| Immigrants | Liberia | 0.1 /100 | #281 | Tragic $74,896 |
| Central American Indians | 0.1 /100 | #282 | Tragic $74,847 |