Afghan vs Immigrants from Micronesia Median Household Income
COMPARE
Afghan
Immigrants from Micronesia
Median Household Income
Median Household Income Comparison
Afghans
Immigrants from Micronesia
$97,026
MEDIAN HOUSEHOLD INCOME
100.0/ 100
METRIC RATING
39th/ 347
METRIC RANK
$75,574
MEDIAN HOUSEHOLD INCOME
0.2/ 100
METRIC RATING
275th/ 347
METRIC RANK
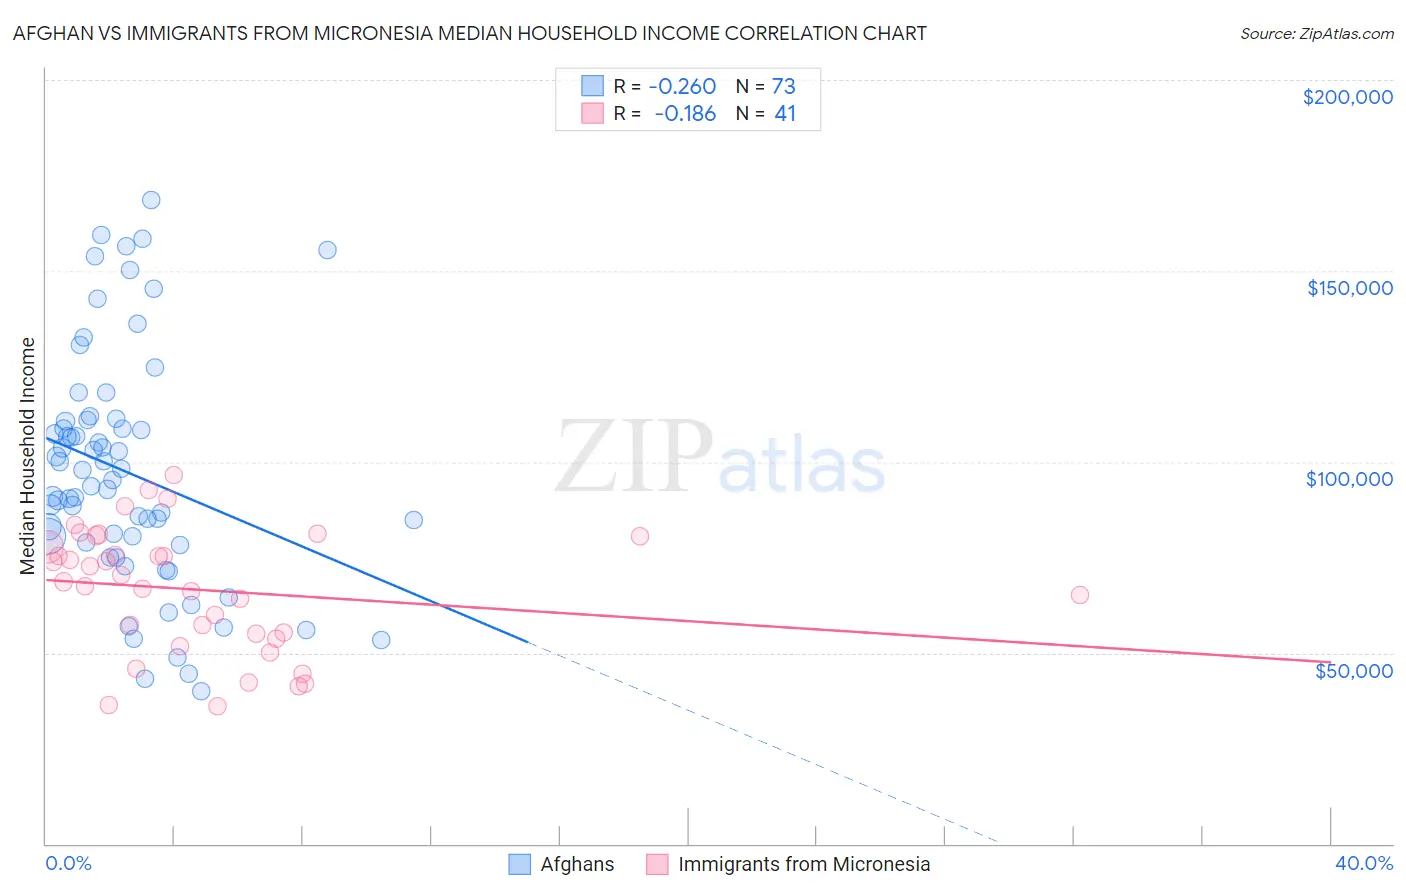
Afghan vs Immigrants from Micronesia Median Household Income Correlation Chart
The statistical analysis conducted on geographies consisting of 148,820,759 people shows a weak negative correlation between the proportion of Afghans and median household income in the United States with a correlation coefficient (R) of -0.260 and weighted average of $97,026. Similarly, the statistical analysis conducted on geographies consisting of 61,597,439 people shows a poor negative correlation between the proportion of Immigrants from Micronesia and median household income in the United States with a correlation coefficient (R) of -0.186 and weighted average of $75,574, a difference of 28.4%.
Median Household Income Correlation Summary
| Measurement | Afghan | Immigrants from Micronesia |
| Minimum | $40,069 | $36,071 |
| Maximum | $168,646 | $96,614 |
| Range | $128,577 | $60,543 |
| Mean | $97,284 | $66,523 |
| Median | $95,399 | $68,636 |
| Interquartile 25% (IQ1) | $78,550 | $54,388 |
| Interquartile 75% (IQ3) | $110,861 | $79,184 |
| Interquartile Range (IQR) | $32,311 | $24,796 |
| Standard Deviation (Sample) | $30,429 | $16,084 |
| Standard Deviation (Population) | $30,220 | $15,887 |
Similar Demographics by Median Household Income
Demographics Similar to Afghans by Median Household Income
In terms of median household income, the demographic groups most similar to Afghans are Maltese ($97,015, a difference of 0.010%), Immigrants from Turkey ($96,964, a difference of 0.060%), Immigrants from Lithuania ($96,836, a difference of 0.20%), Immigrants from Indonesia ($97,297, a difference of 0.28%), and Latvian ($97,311, a difference of 0.29%).
| Demographics | Rating | Rank | Median Household Income |
| Immigrants | Denmark | 100.0 /100 | #32 | Exceptional $98,510 |
| Chinese | 100.0 /100 | #33 | Exceptional $98,496 |
| Russians | 100.0 /100 | #34 | Exceptional $98,008 |
| Immigrants | Switzerland | 100.0 /100 | #35 | Exceptional $97,979 |
| Immigrants | Pakistan | 100.0 /100 | #36 | Exceptional $97,528 |
| Latvians | 100.0 /100 | #37 | Exceptional $97,311 |
| Immigrants | Indonesia | 100.0 /100 | #38 | Exceptional $97,297 |
| Afghans | 100.0 /100 | #39 | Exceptional $97,026 |
| Maltese | 100.0 /100 | #40 | Exceptional $97,015 |
| Immigrants | Turkey | 100.0 /100 | #41 | Exceptional $96,964 |
| Immigrants | Lithuania | 99.9 /100 | #42 | Exceptional $96,836 |
| Immigrants | France | 99.9 /100 | #43 | Exceptional $96,743 |
| Immigrants | Greece | 99.9 /100 | #44 | Exceptional $96,675 |
| Israelis | 99.9 /100 | #45 | Exceptional $96,552 |
| Australians | 99.9 /100 | #46 | Exceptional $96,490 |
Demographics Similar to Immigrants from Micronesia by Median Household Income
In terms of median household income, the demographic groups most similar to Immigrants from Micronesia are British West Indian ($75,647, a difference of 0.10%), Liberian ($75,667, a difference of 0.12%), Immigrants from Latin America ($75,420, a difference of 0.20%), Spanish American ($75,386, a difference of 0.25%), and Somali ($75,782, a difference of 0.27%).
| Demographics | Rating | Rank | Median Household Income |
| Immigrants | Jamaica | 0.3 /100 | #268 | Tragic $75,851 |
| Cape Verdeans | 0.3 /100 | #269 | Tragic $75,848 |
| Hmong | 0.3 /100 | #270 | Tragic $75,839 |
| Pennsylvania Germans | 0.3 /100 | #271 | Tragic $75,814 |
| Somalis | 0.3 /100 | #272 | Tragic $75,782 |
| Liberians | 0.2 /100 | #273 | Tragic $75,667 |
| British West Indians | 0.2 /100 | #274 | Tragic $75,647 |
| Immigrants | Micronesia | 0.2 /100 | #275 | Tragic $75,574 |
| Immigrants | Latin America | 0.2 /100 | #276 | Tragic $75,420 |
| Spanish Americans | 0.2 /100 | #277 | Tragic $75,386 |
| Osage | 0.2 /100 | #278 | Tragic $75,240 |
| Immigrants | Guatemala | 0.2 /100 | #279 | Tragic $75,123 |
| Senegalese | 0.2 /100 | #280 | Tragic $74,999 |
| Immigrants | Liberia | 0.1 /100 | #281 | Tragic $74,896 |
| Central American Indians | 0.1 /100 | #282 | Tragic $74,847 |